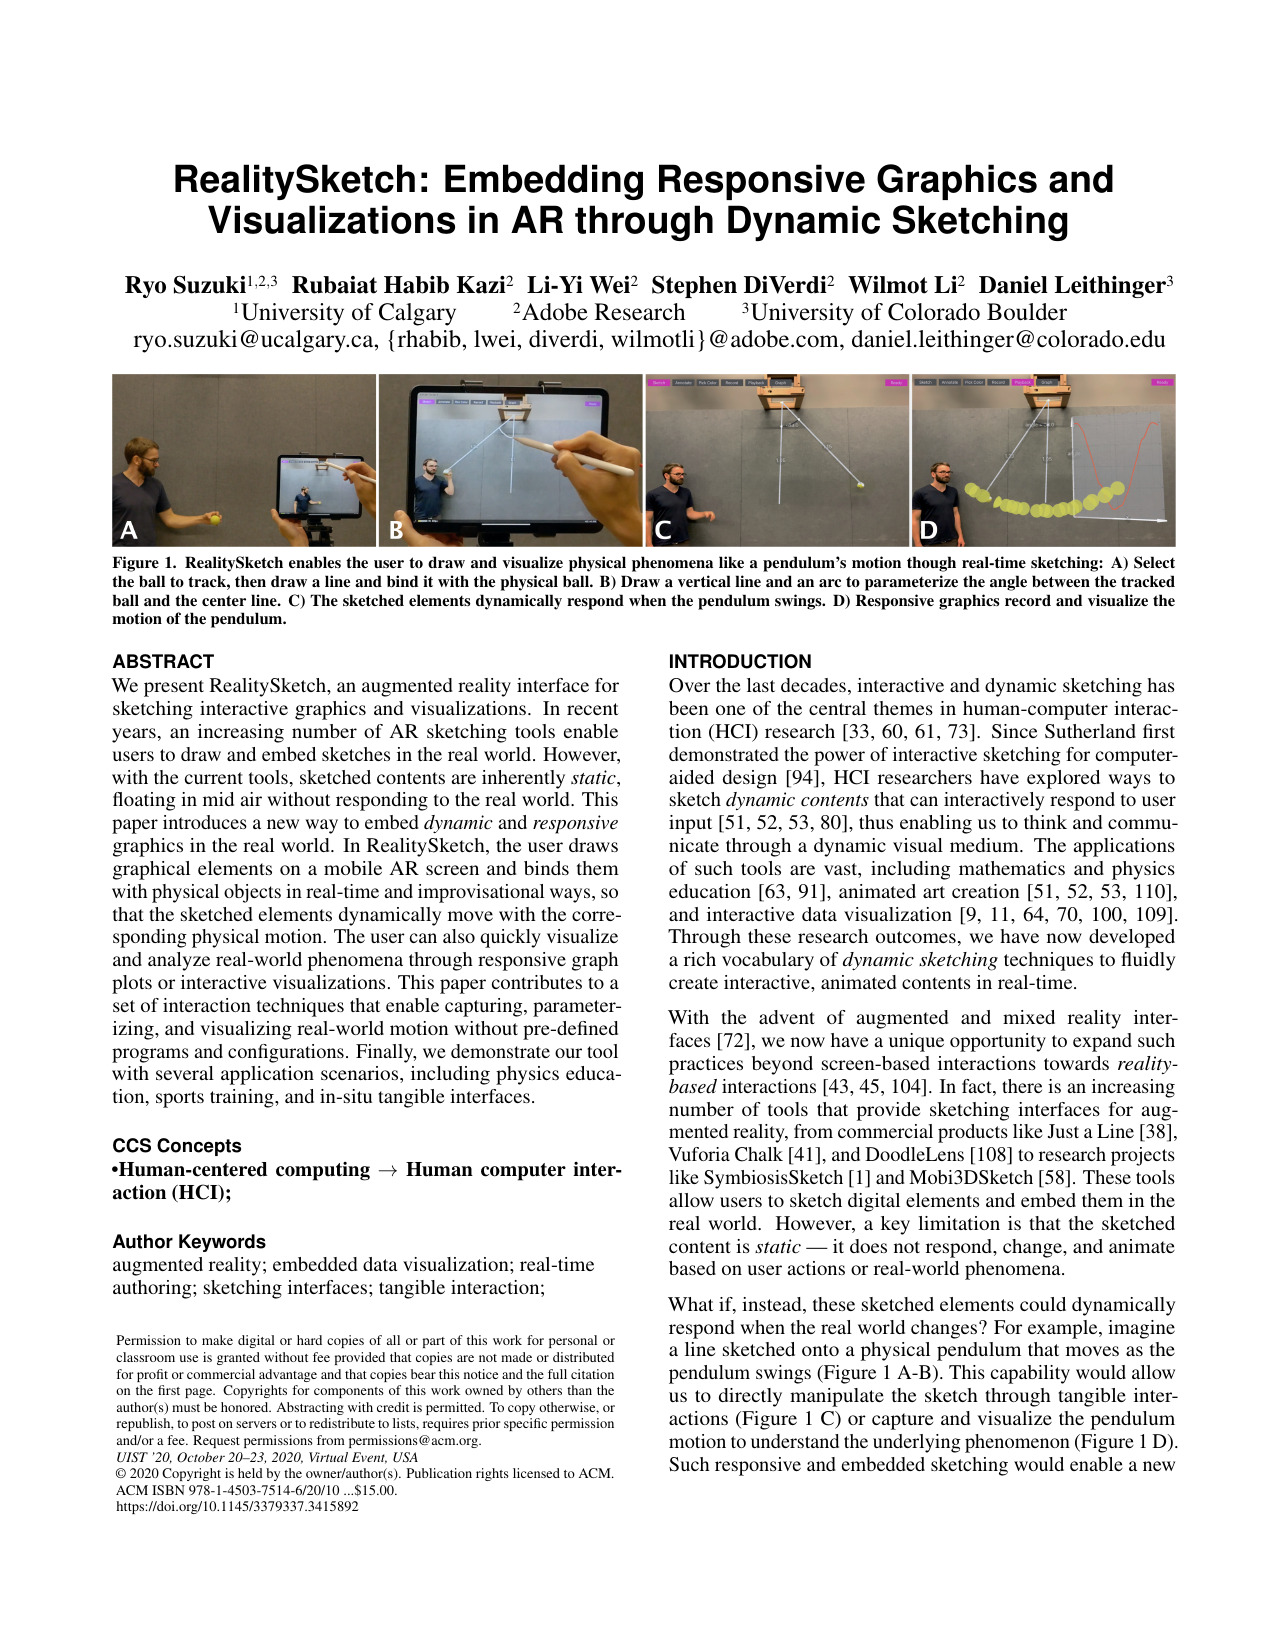
RealitySketch: Embedding Responsive Graphics and Visualizations in AR through Dynamic Sketching
Abstract
We present RealitySketch, an augmented reality interface for sketching interactive graphics and visualizations. In recent years, an increasing number of AR sketching tools enable users to draw and embed sketches in the real world. However, with the current tools, sketched contents are inherently static, floating in mid-air without responding to the real world. This paper introduces a new way to embed dynamic and responsive graphics in the real world. In RealitySketch, the user draws graphical elements on a mobile AR screen and binds them with physical objects in real-time and improvisational ways, so that the sketched elements dynamically move with the corresponding physical motion. The user can also quickly visualize and analyze real-world phenomena through responsive graph plots or interactive visualizations. This paper contributes to a set of interaction techniques that enable capturing, parameterizing, and visualizing real-world motion without pre-defined programs and configurations. Finally, we demonstrate our tool with several application scenarios, including physics education, sports training, and in-situ tangible interfaces.
Introduction
Over the last decades, interactive and dynamic sketching has been one of the central themes in human-computer interaction (HCI) research. Since Sutherland first demonstrated the power of interactive sketching for computer-aided design, HCI researchers have explored ways to sketch dynamic contents that can interactively respond to user input, thus enabling us to think and communicate through a dynamic visual medium. The applications of such tools are vast, including mathematics and physics education, animated art creation, and interactive data visualization. Through these research outcomes, we have now developed a rich vocabulary of dynamic sketching techniques to fluidly create interactive, animated content in real-time.
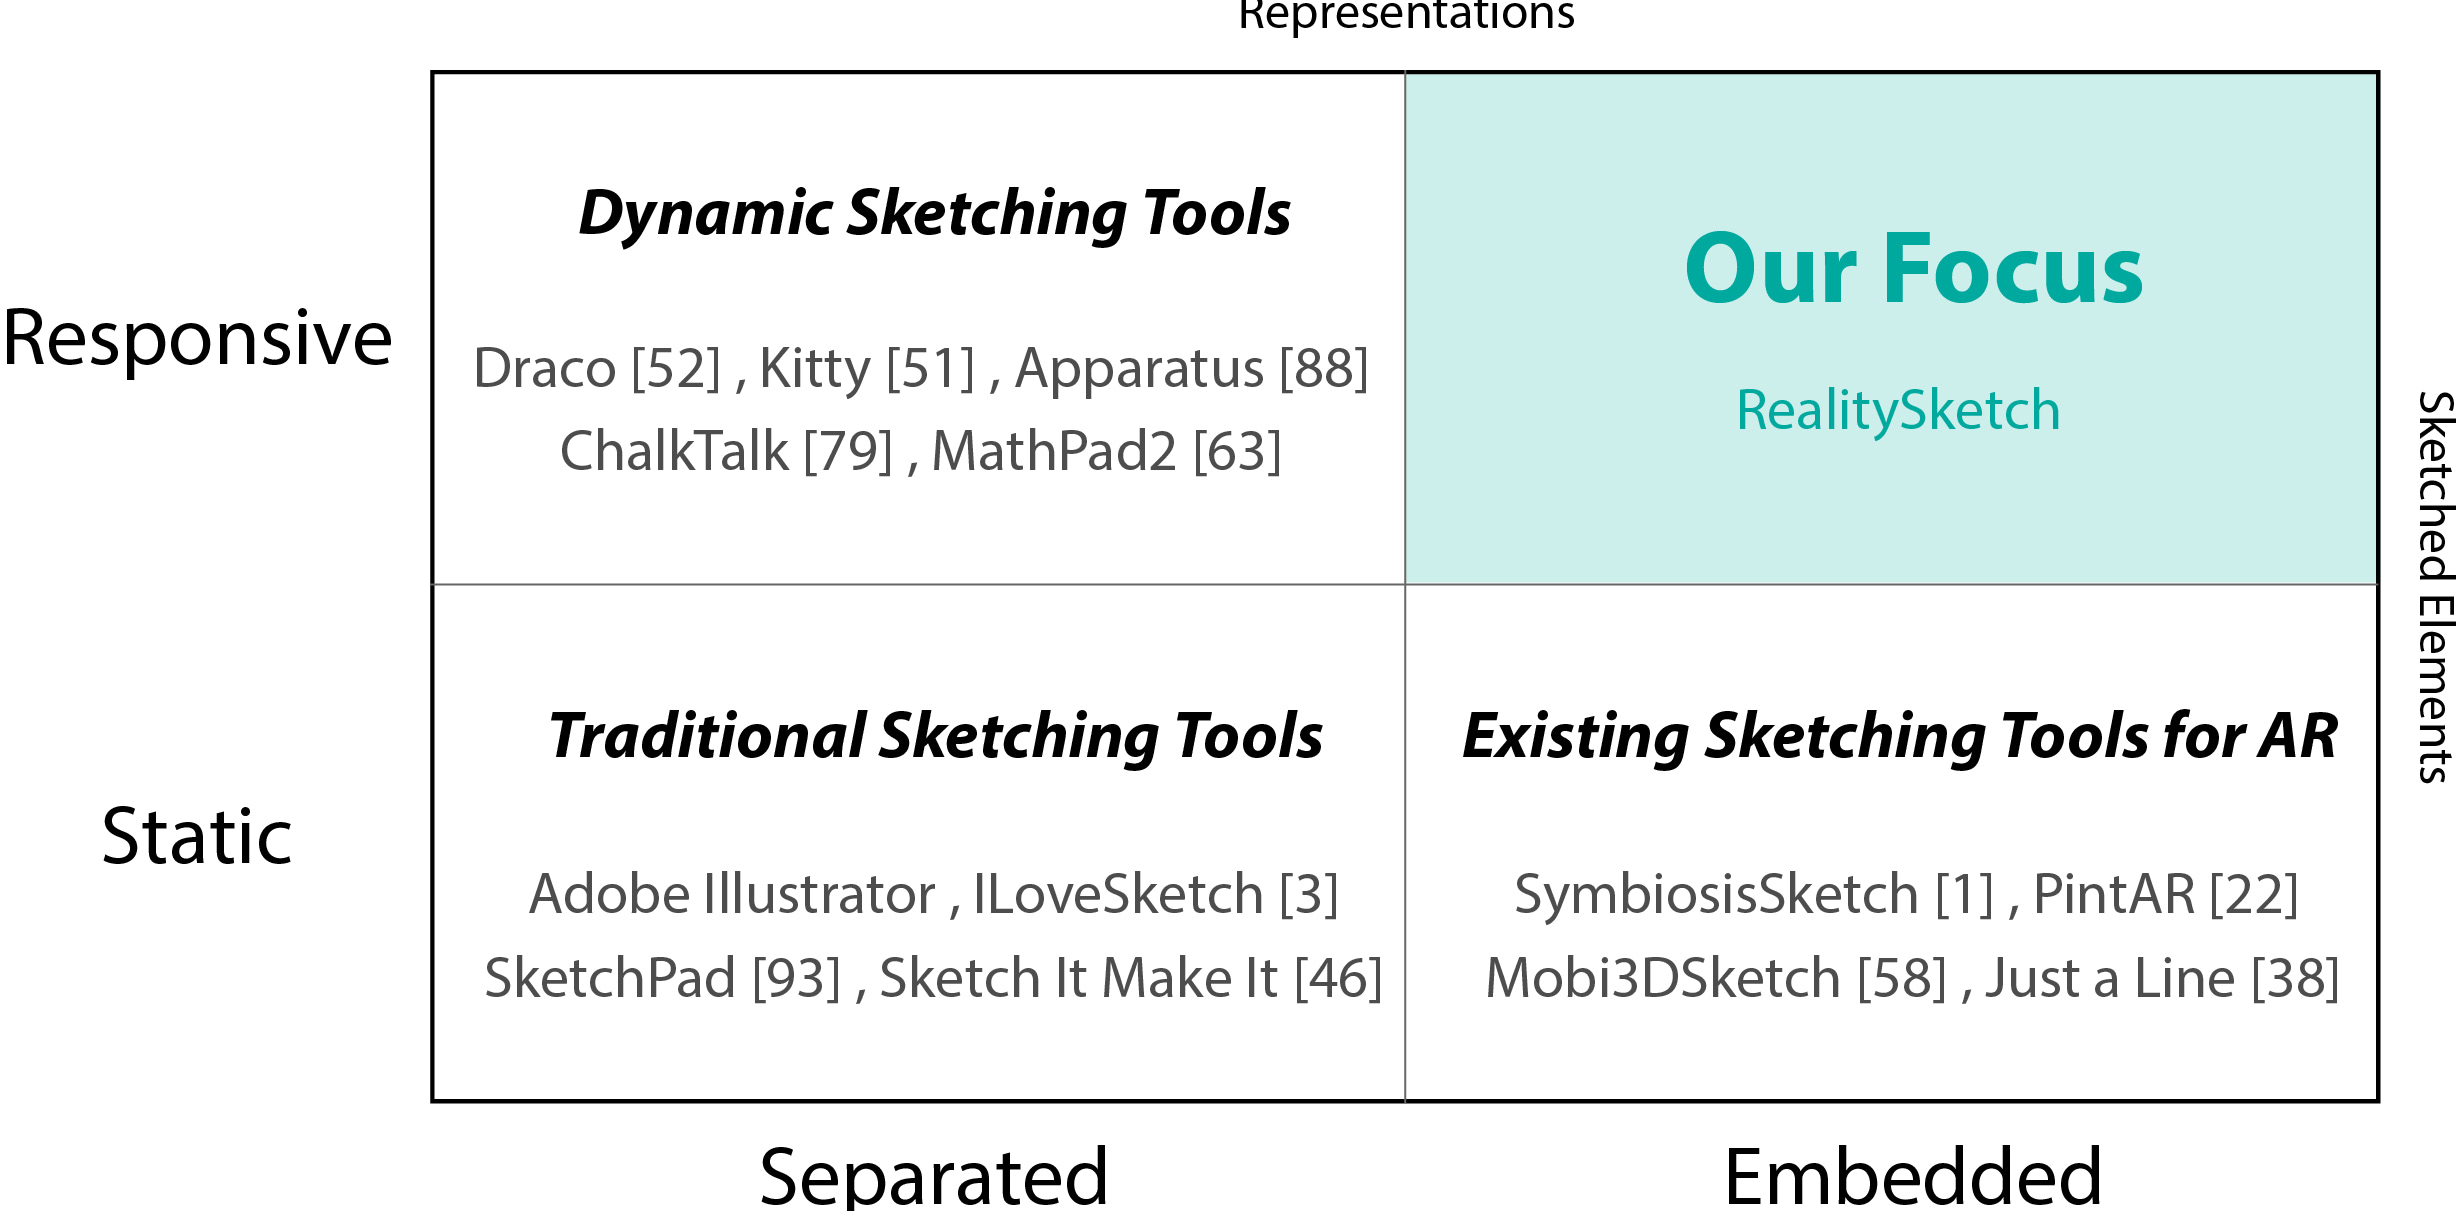
With the advent of augmented and mixed reality interfaces, we now have a unique opportunity to expand such practices beyond screen-based interactions towards reality-based interactions. In fact, there is an increasing number of tools that provide sketching interfaces for augmented reality, from commercial products like Just a Line, Vuforia Chalk, and DoodleLens to research projects like SymbiosisSketch and Mobi3DSketch. These tools allow users to sketch digital elements and embed them in the real world. However, a key limitation is that the sketched content is static --- it does not respond, change, and animate based on user actions or real-world phenomena.
What if, instead, these sketched elements could dynamically respond when the real world changes? For example, imagine a line sketched onto a physical pendulum that moves as the pendulum swings. This capability would allow us to directly manipulate the sketch through tangible interactions or capture and visualize the pendulum motion to understand the underlying phenomenon.
As a first step toward this goal, we present RealitySketch, an end-user sketching tool to support real-time creation and sharing of embedded interactive graphics and visualization in AR. To create graphics, the user sketches on a phone or tablet screen, which embeds interactive visualizations into a scene. The sketched elements can be bound to physical objects such that they respond dynamically as the real-world changes.
RealitySketch: How it works
Design Space and Basic Setup
The goal of this paper is to provide a way to embed dynamic and responsive graphics through dynamic sketching. To better understand the scope, we first define the terminology:
- Embedded: graphics are presented and spatially integrated within the real-world
- Responsive: graphics change and animate based on the user’s interactions
The important aspect of embedded and responsive graphics is that graphics must interact with the real-world. Here, the “real- world” means either the environment itself, a physical phenomenon, or a user’s tangible and gestural interactions.
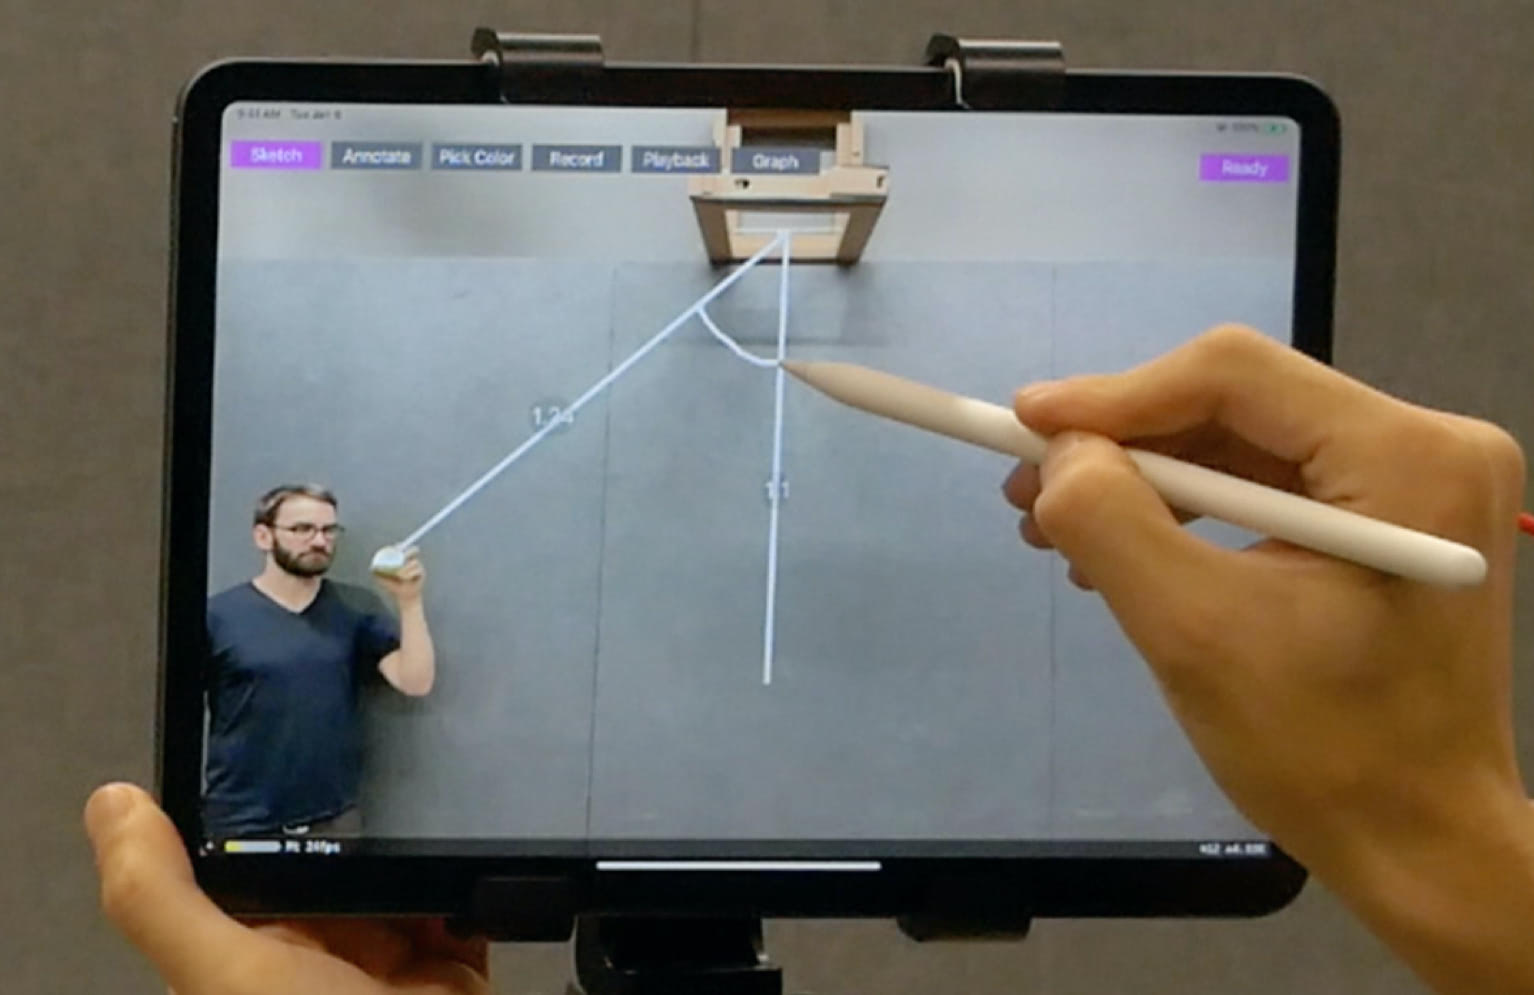
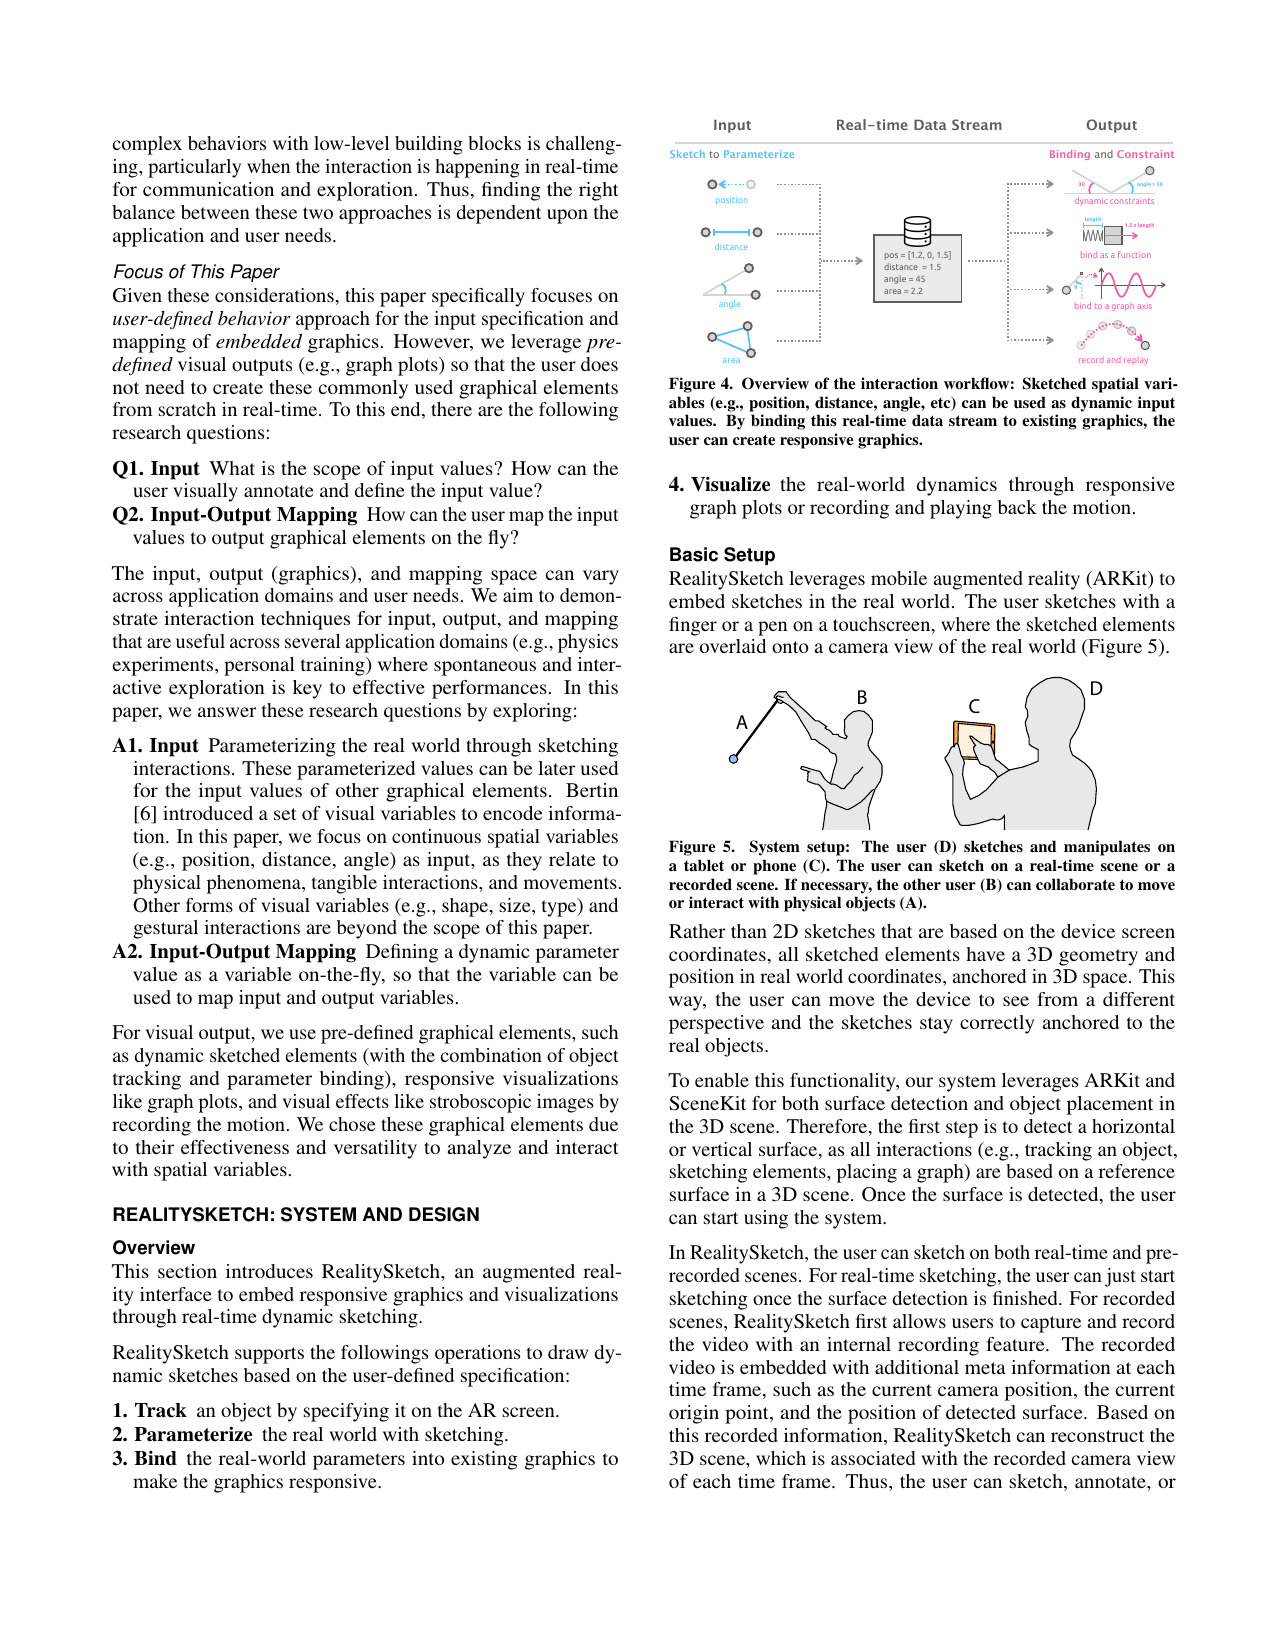
To enable that, RealitySketch leverages mobile augmented reality (ARKit) to embed sketches in the real world. The user sketches with a finger or a pen on a touchscreen, where the sketched elements are overlaid onto a camera view of the real world.
Our approach proposes the following four-step workflow:
- Object tracking: the user specifies a visual entity (e.g., a physical object, a skeletal joint) to track in the real-world scene
- Parameterization: the user parameterizes tracked entities by drawing lines or arcs that define specific variables of interest
- Parameter binding: the user binds these variables to the graphical properties of sketched elements (e.g., length, angle, etc.) to define their dynamic behavior as the real-world variables change
- Visualization: the user can also interact, analyze, and visualize real-world movements through several visualization effects.
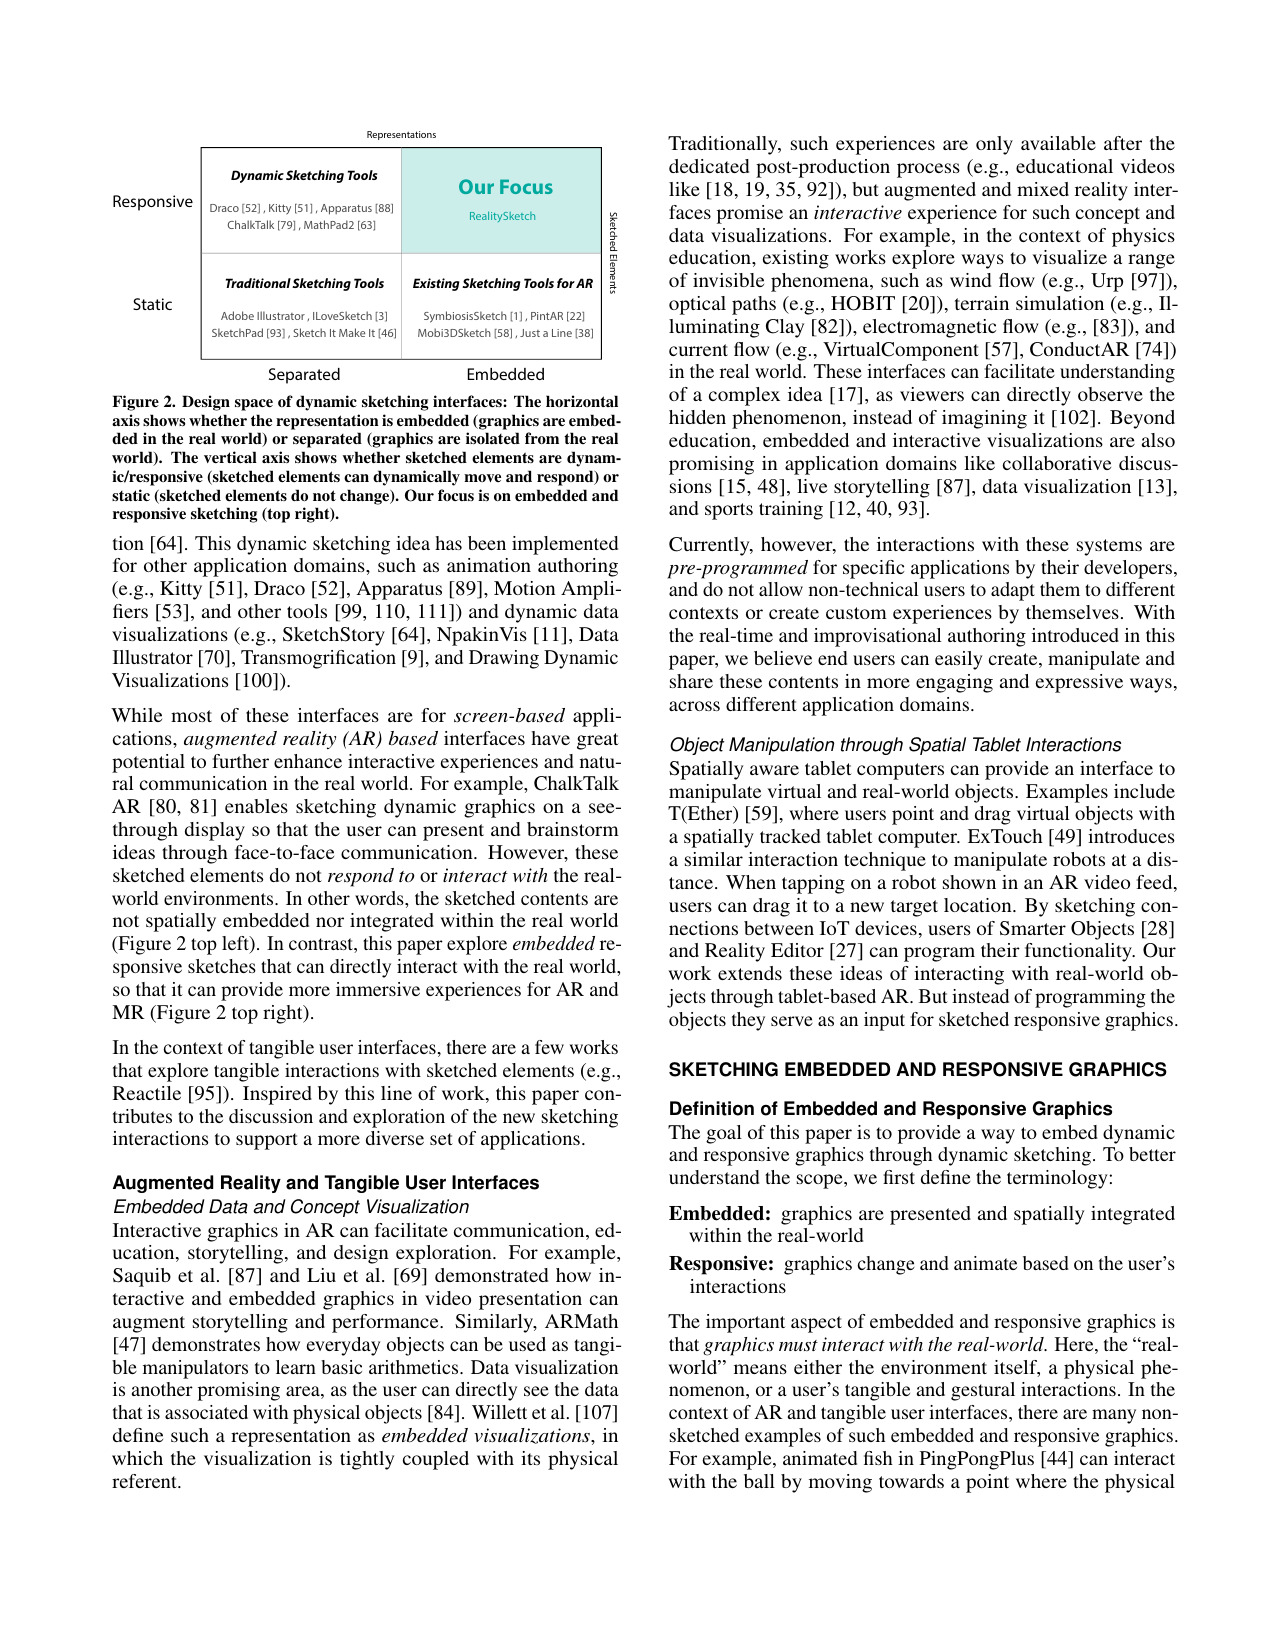
We contextualize our approach in the larger design space of dynamic graphics authoring approaches. The main contribution of this paper is a set of interaction techniques that enable these steps without pre-defined programs and configurations --- rather, the system lets the user perform in real-time and improvisational ways.
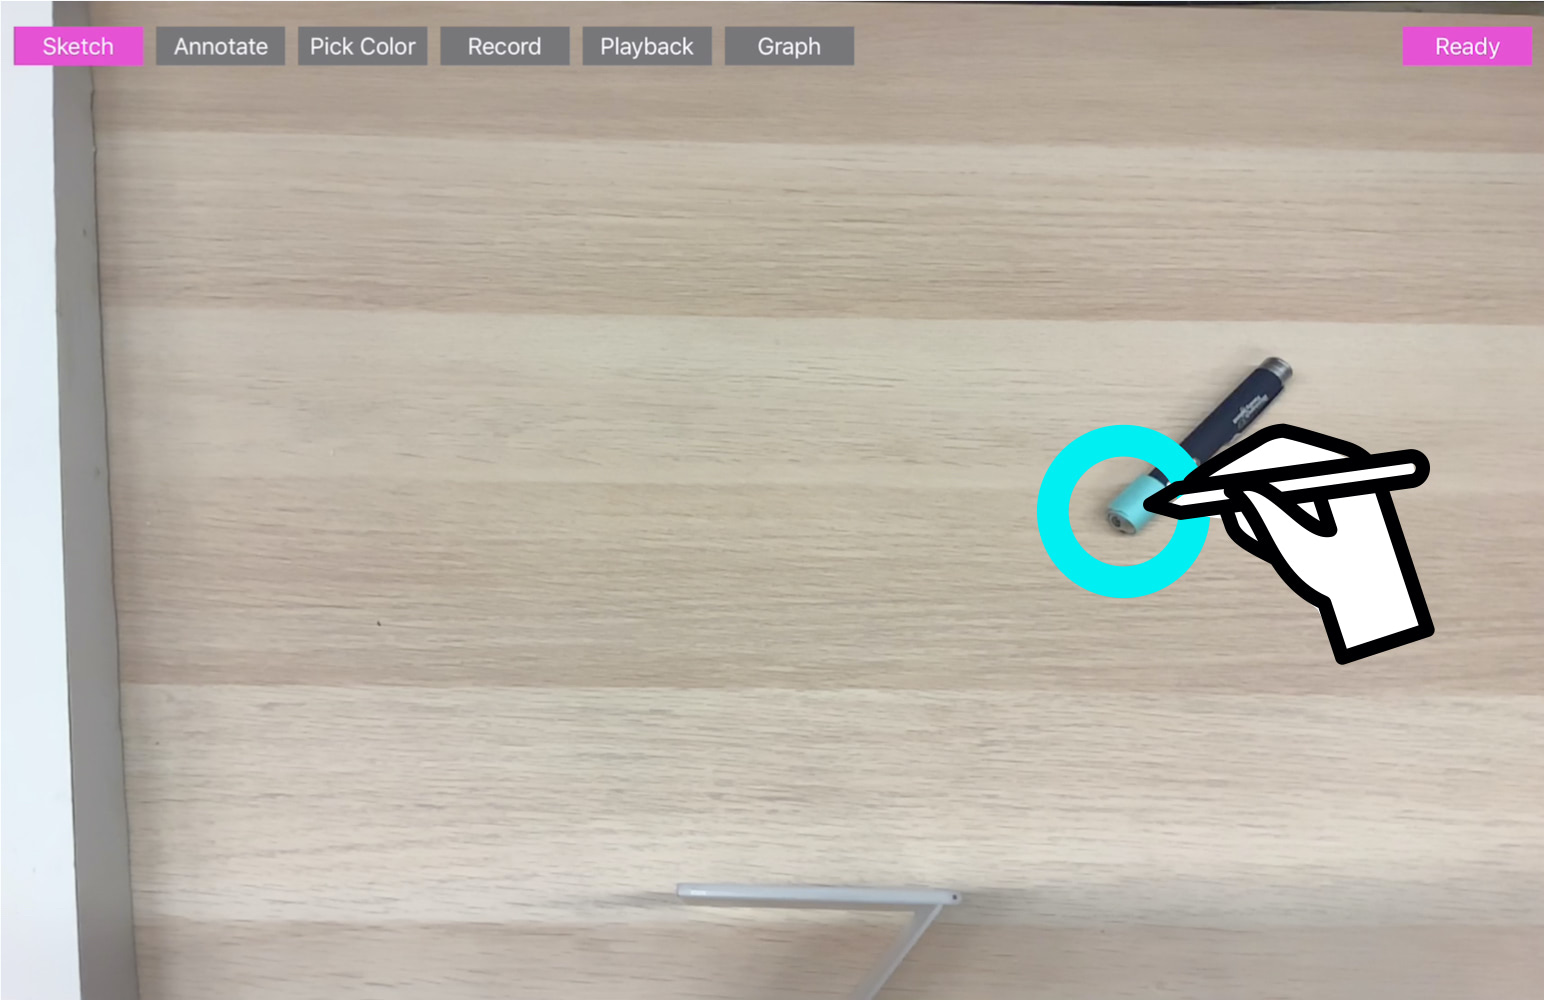
Step 1: Track an Object
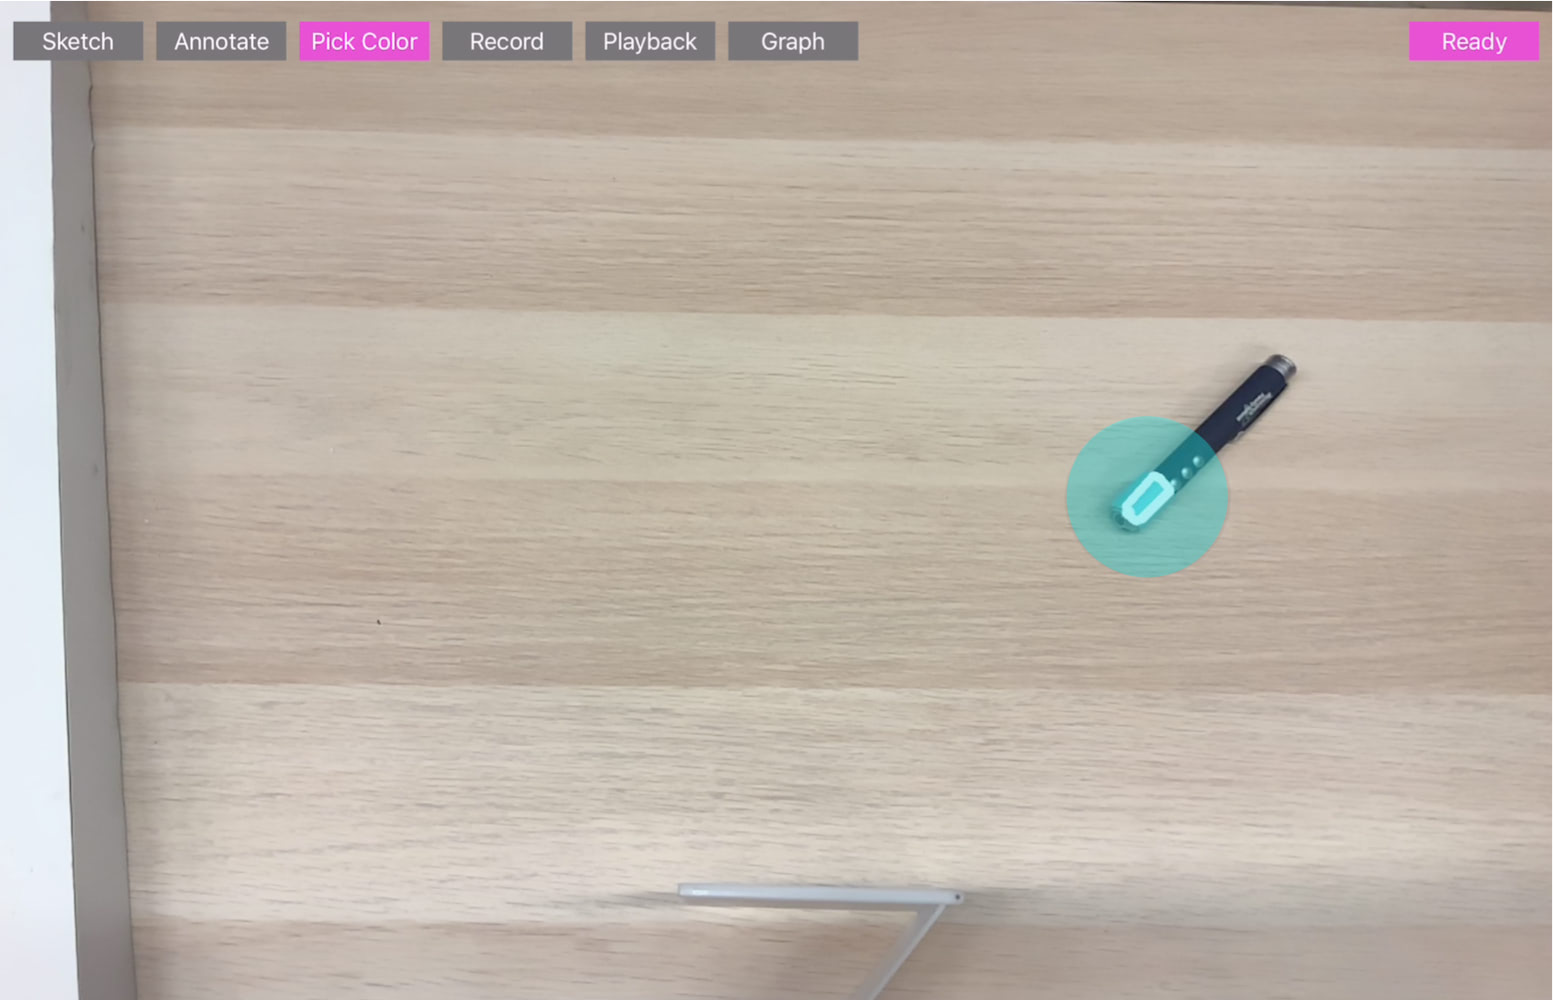
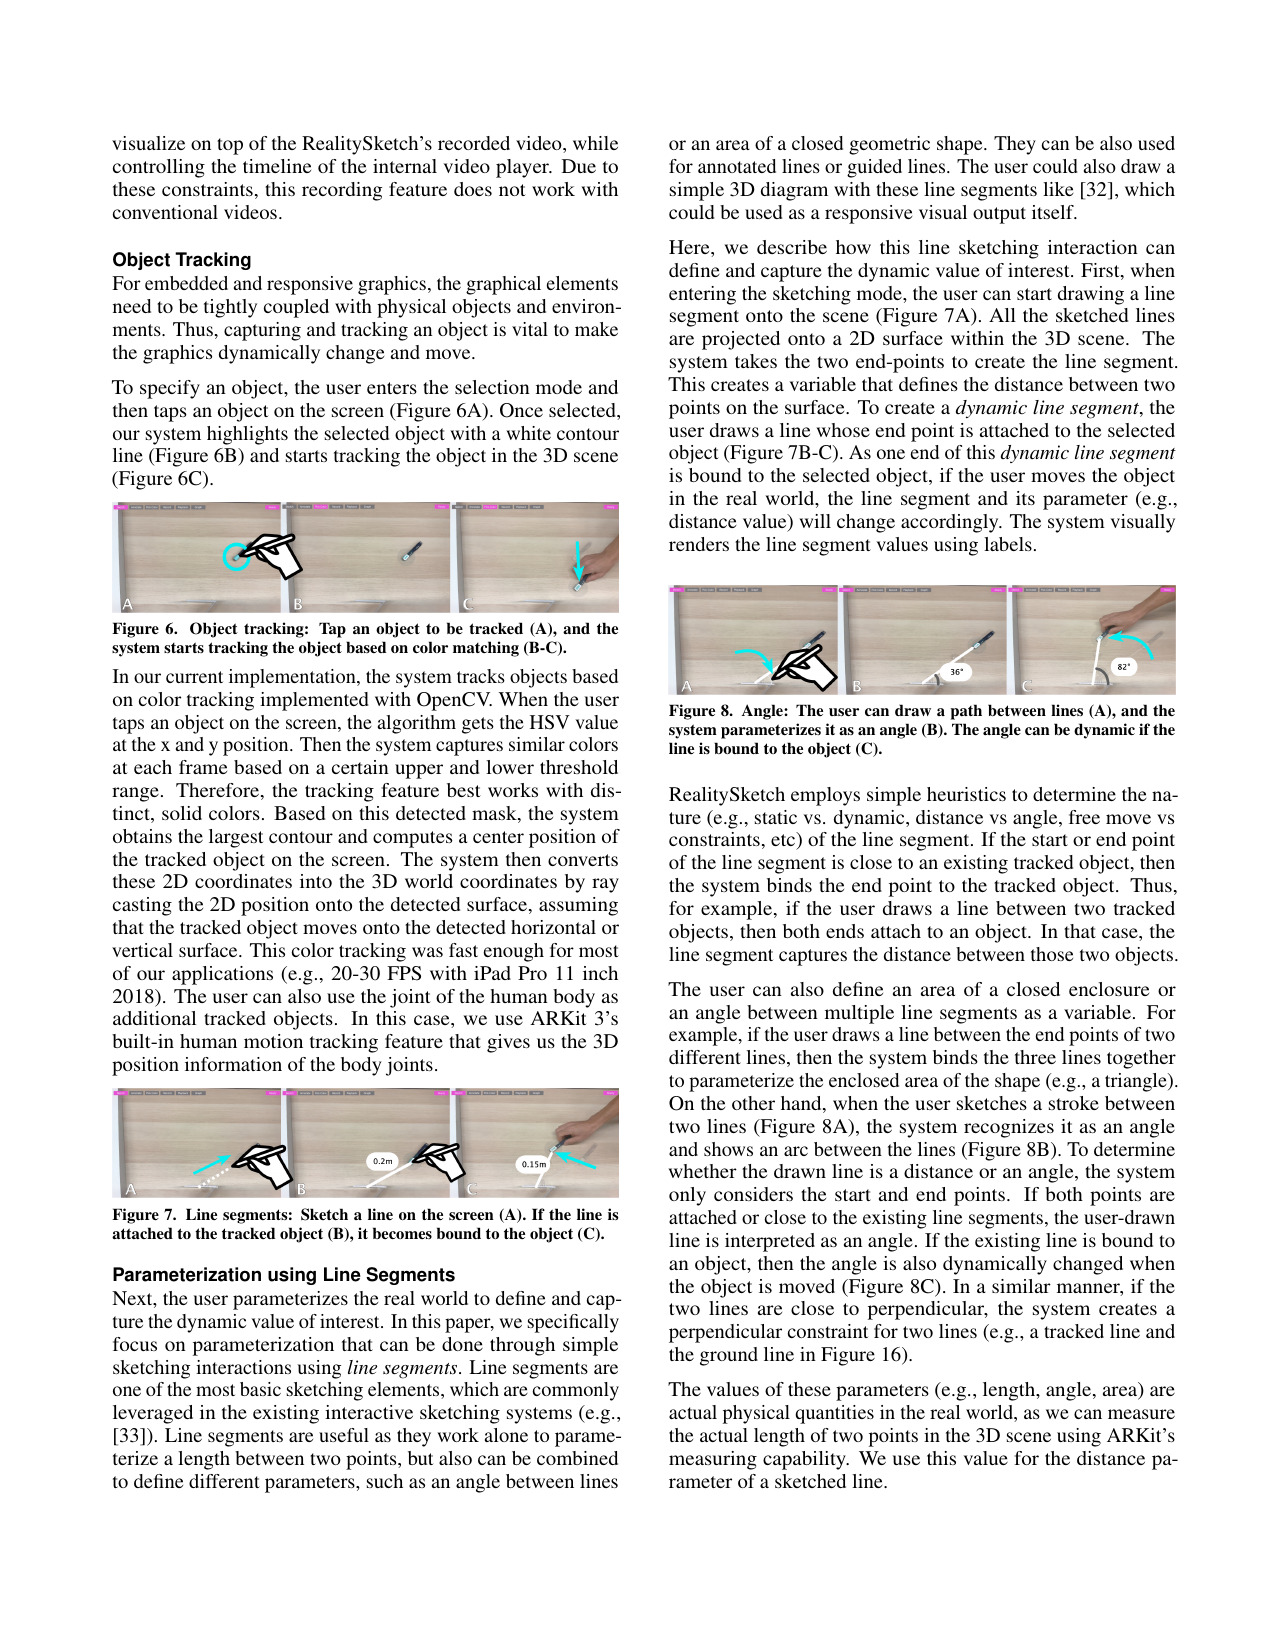
For embedded and responsive graphics, the graphical elements need to be tightly coupled with physical objects and environments. Thus, capturing and tracking an object is vital to make the graphics dynamically change and move. To specify an object, the user enters the selection mode and then taps an object on the screen. Once selected, our system highlights the selected object with a white contour line and starts tracking the object in the 3D scene.
In our current implementation, the system tracks objects based on color tracking implemented with OpenCV. When the user taps an object on the screen, the algorithm gets the HSV value at the x and y position. Then the system captures similar colors at each frame based on a certain upper and lower threshold range. This color tracking was fast enough for most of our applications (e.g., 20-30 FPS with iPad Pro 11 inch 2018).

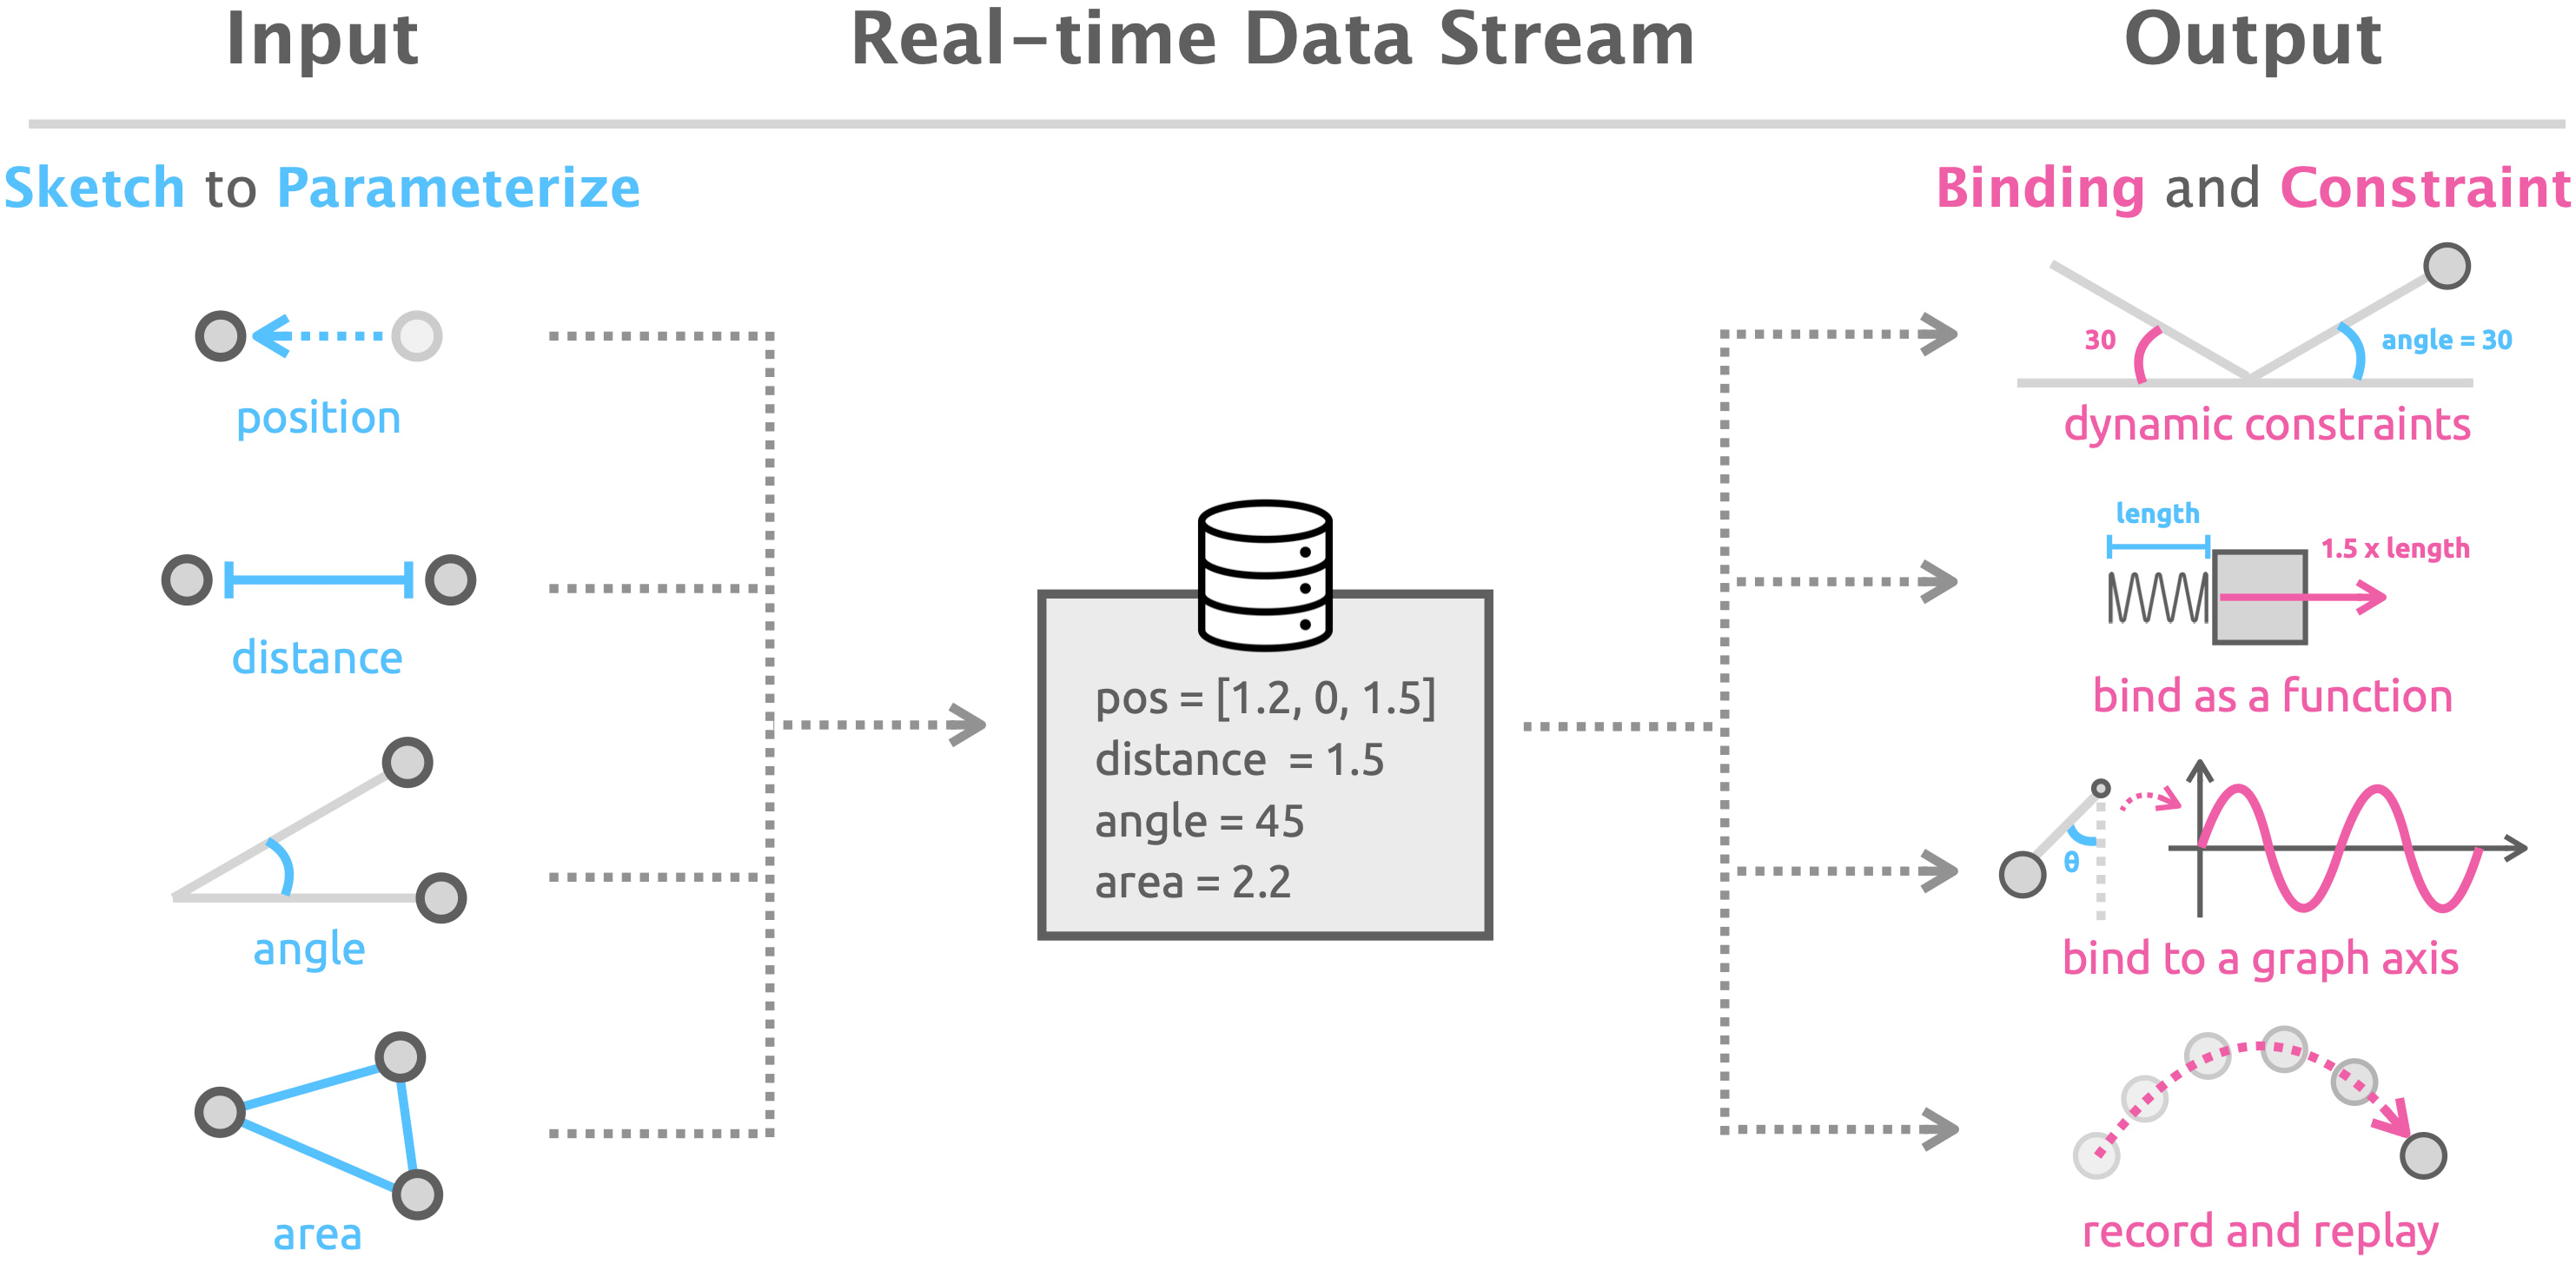
Step 2: Sketch to Parameterize
Next, the user parameterizes the real world to define and capture the dynamic value of interest. In this paper, we specifically focus on parameterization that can be done through simple sketching interactions using line segments.
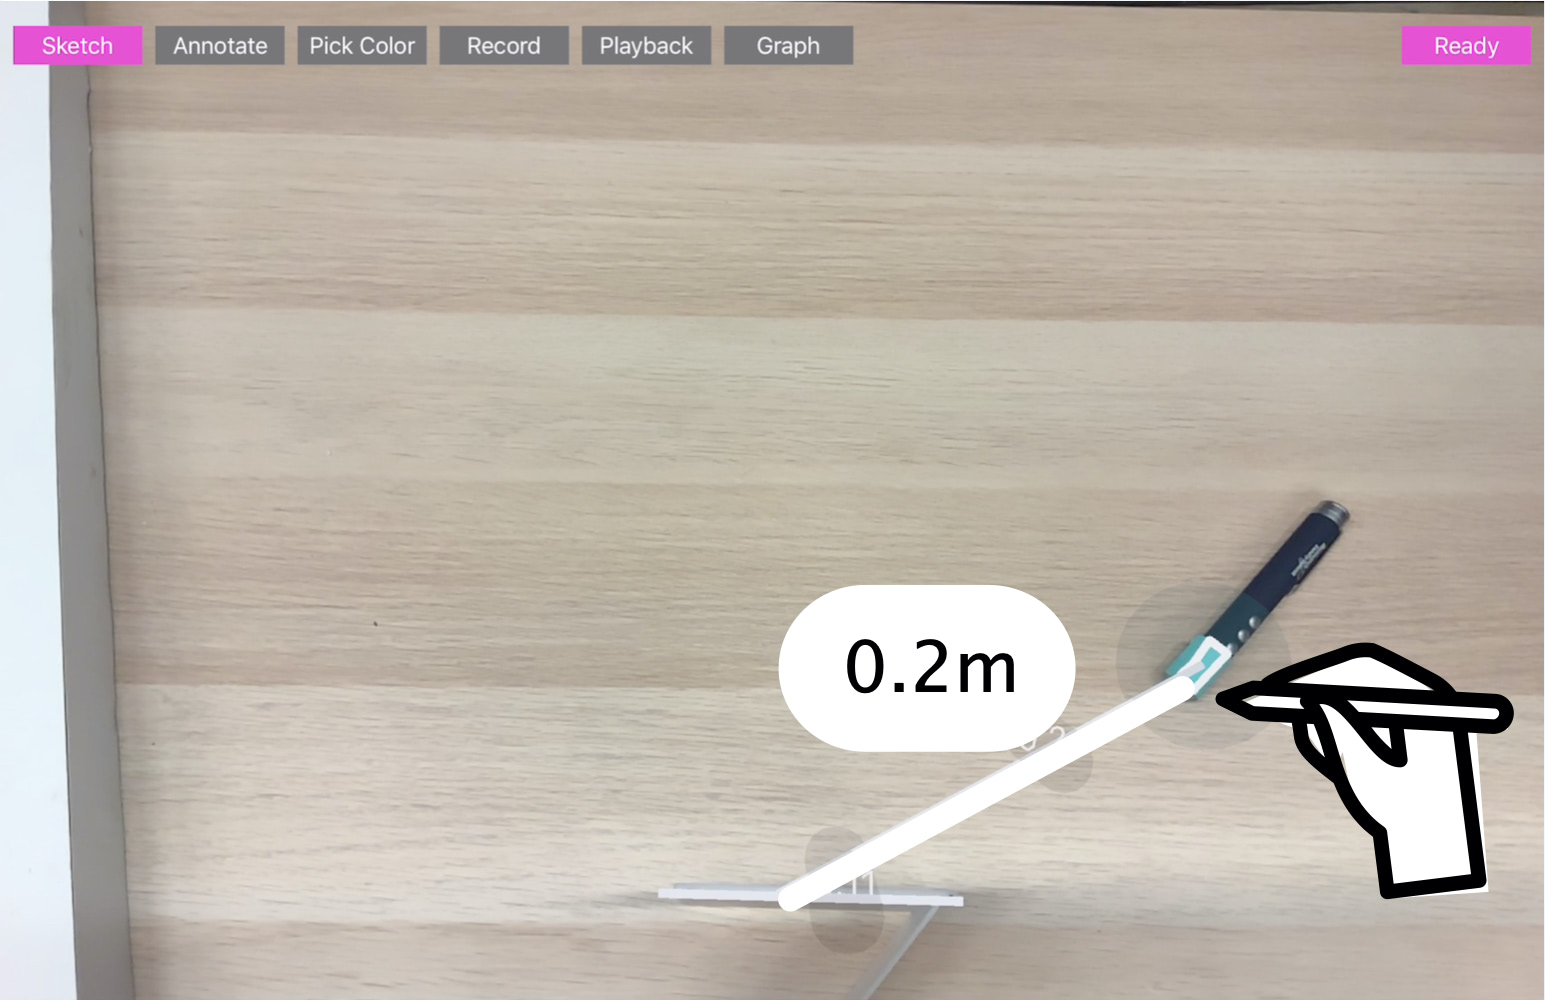
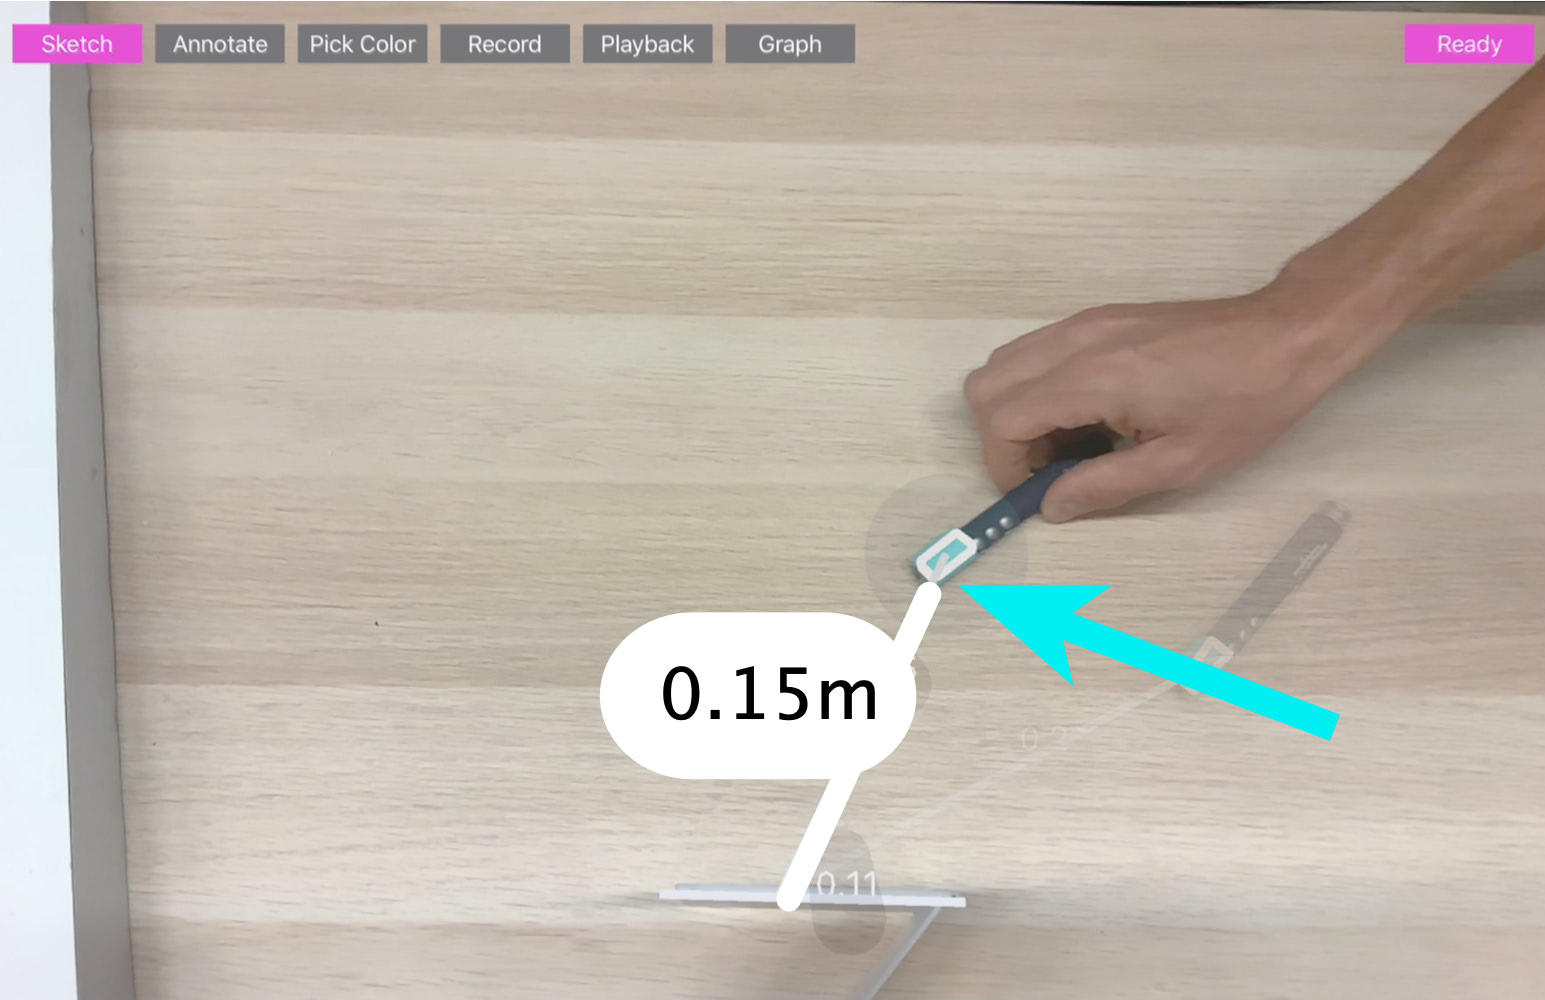
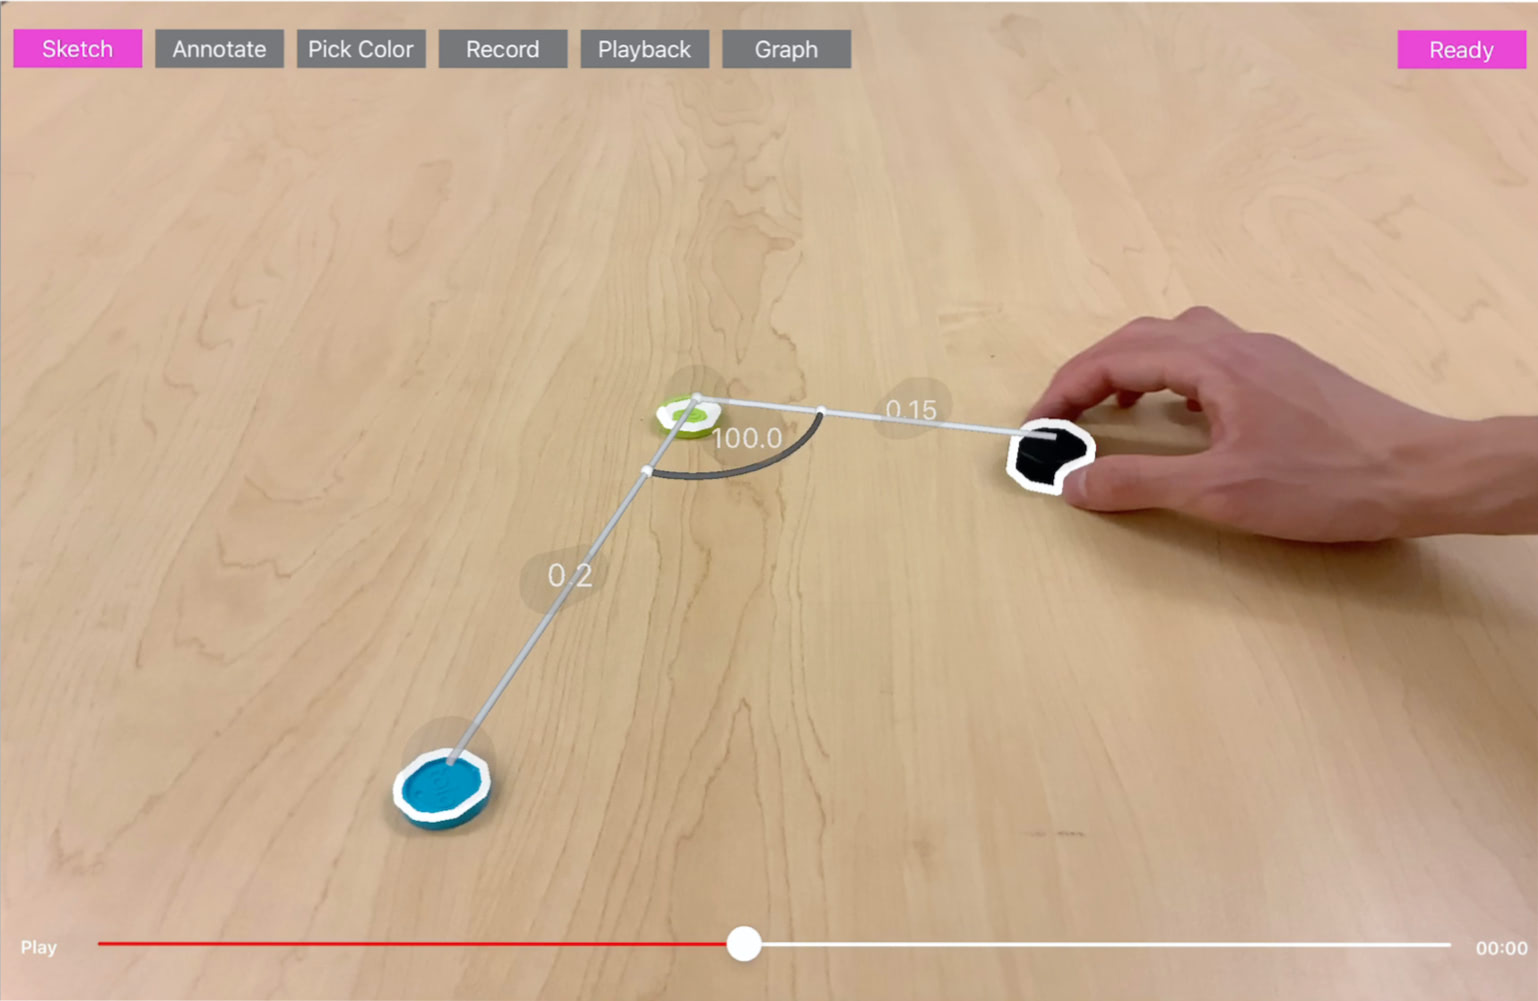
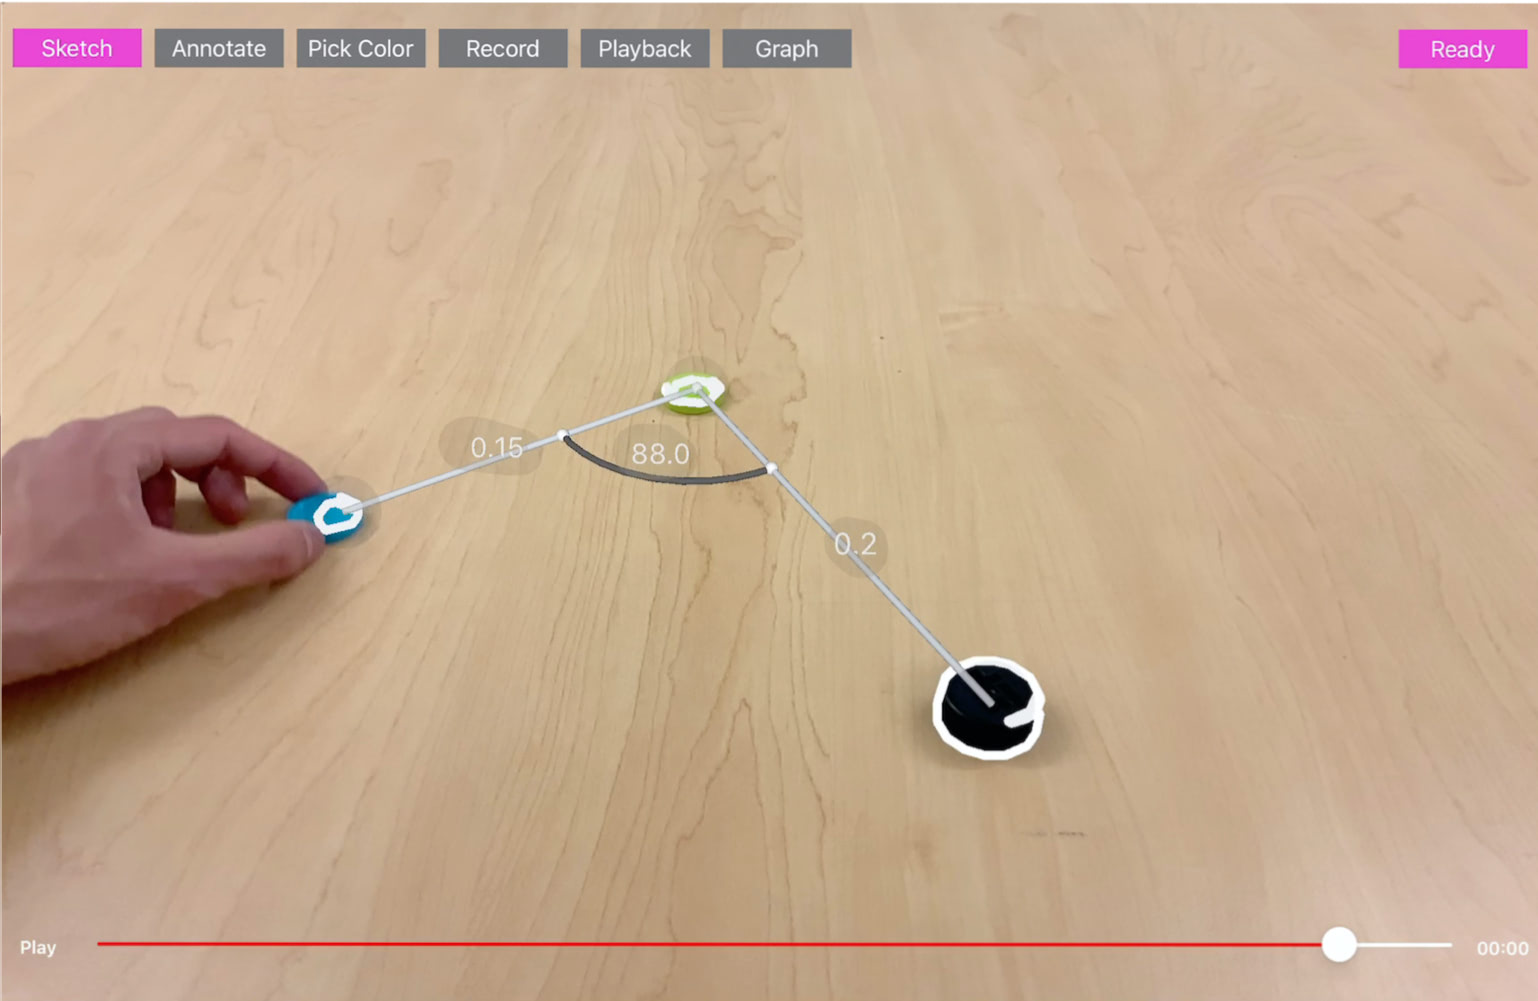
First, when entering the sketching mode, the user can start drawing a line segment onto the scene. All the sketched lines are projected onto a 2D surface within the 3D scene. The system takes the two end-points to create the line segment. This creates a variable that defines the distance between two points on the surface. To create a dynamic line segment, the user draws a line whose endpoint is attached to the selected object. As one end of this dynamic line segment is bound to the selected object, if the user moves the object in the real world, the line segment and its parameter (e.g., distance value) will change accordingly. The system visually renders the line segment values using labels.
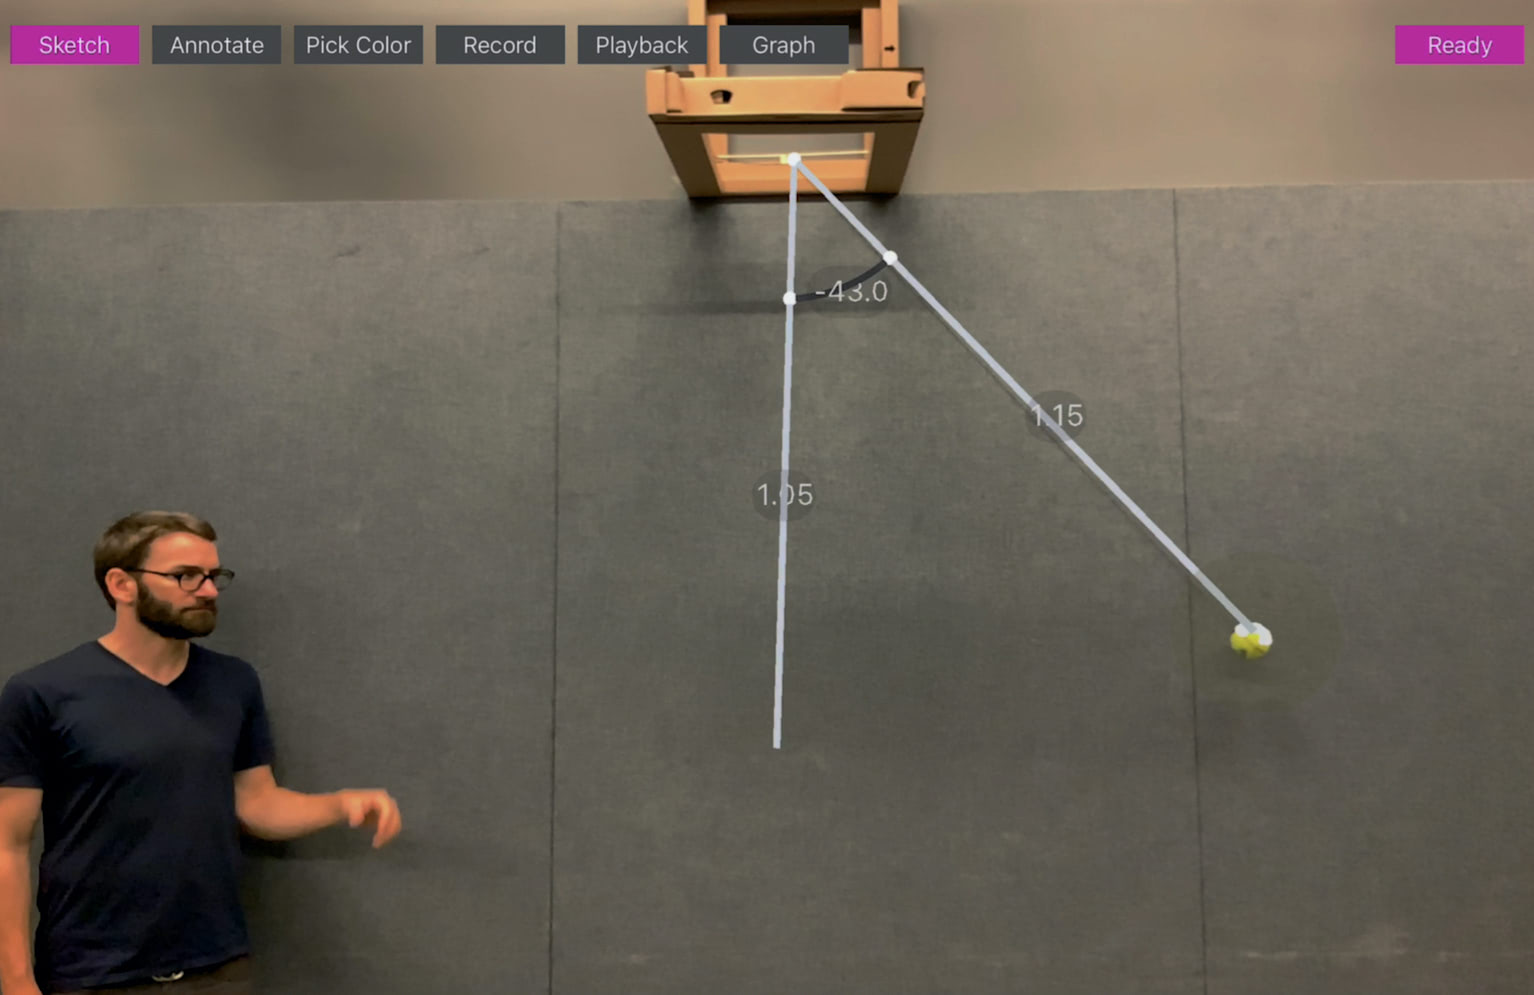
RealitySketch employs simple heuristics to determine the nature (e.g., static vs. dynamic, distance vs angle, free move vs constraints, etc) of the line segment. If the start or end point of the line segment is close to an existing tracked object, then the system binds the end point to the tracked object. Thus, for example, if the user draws a line between two tracked objects, then both ends attach to an object. In that case, the line segment captures the distance between those two objects.


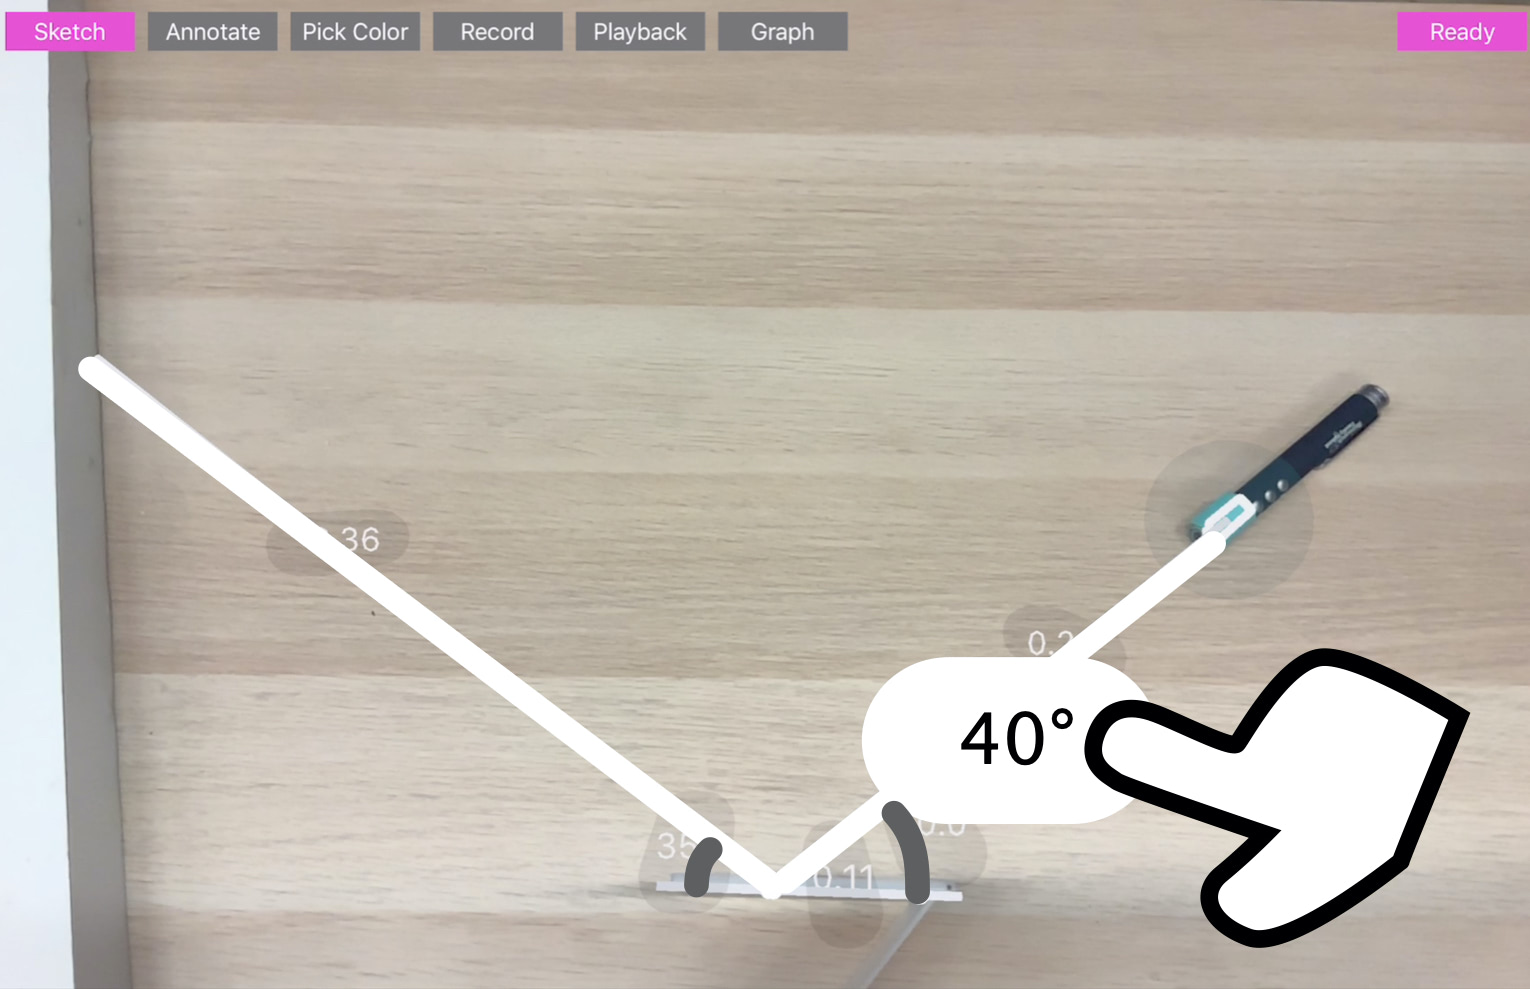
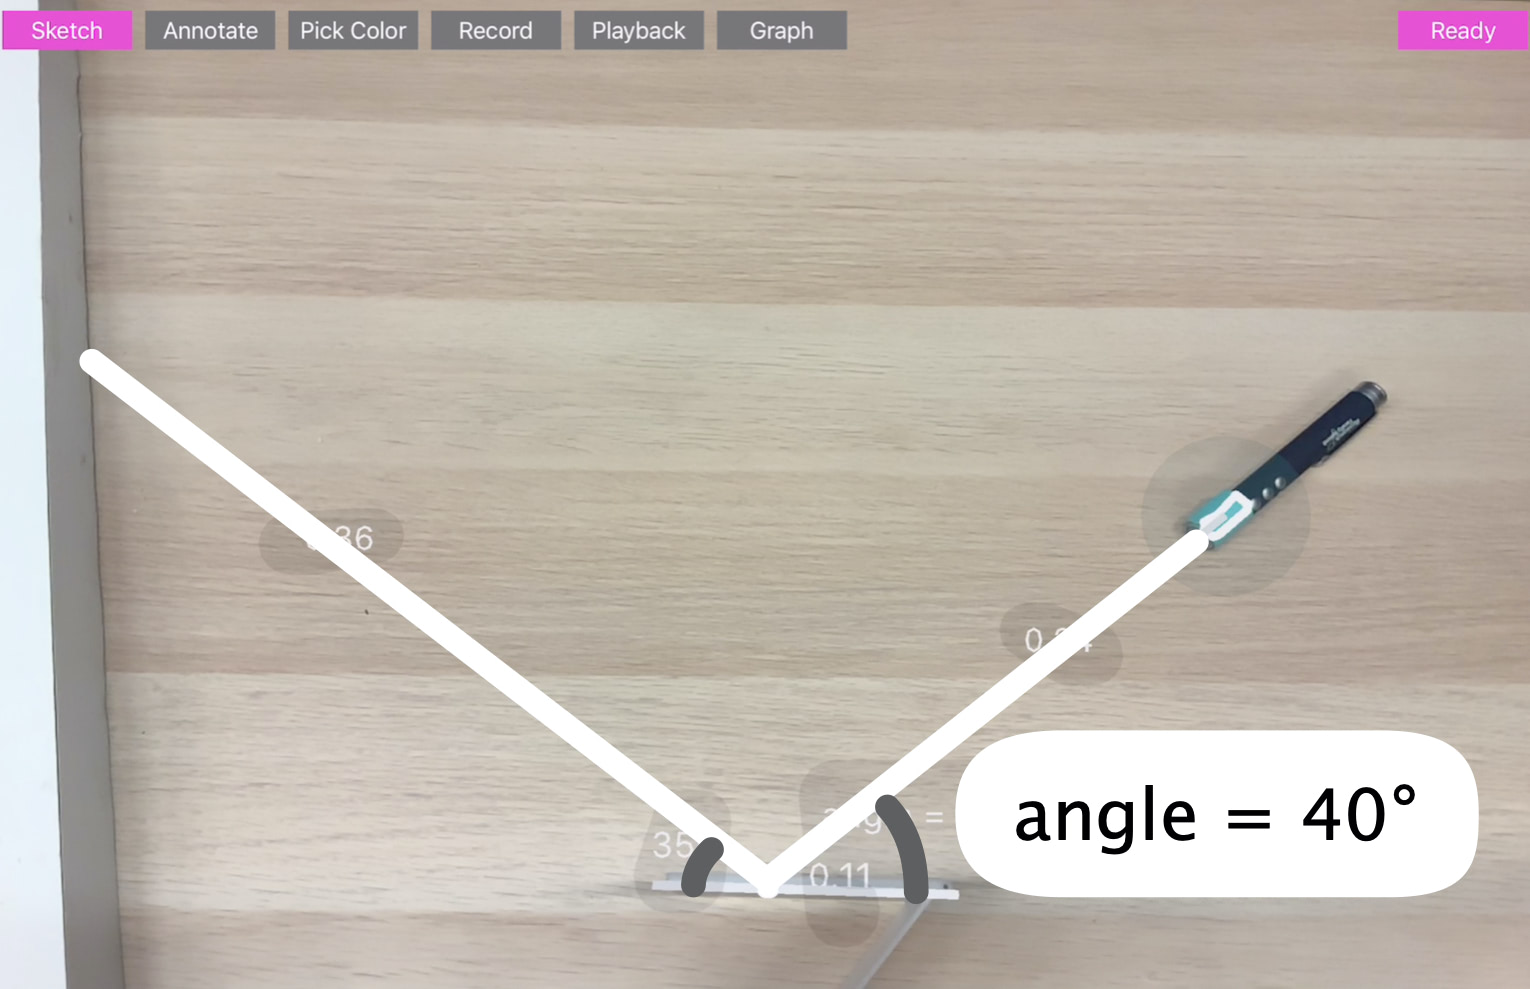
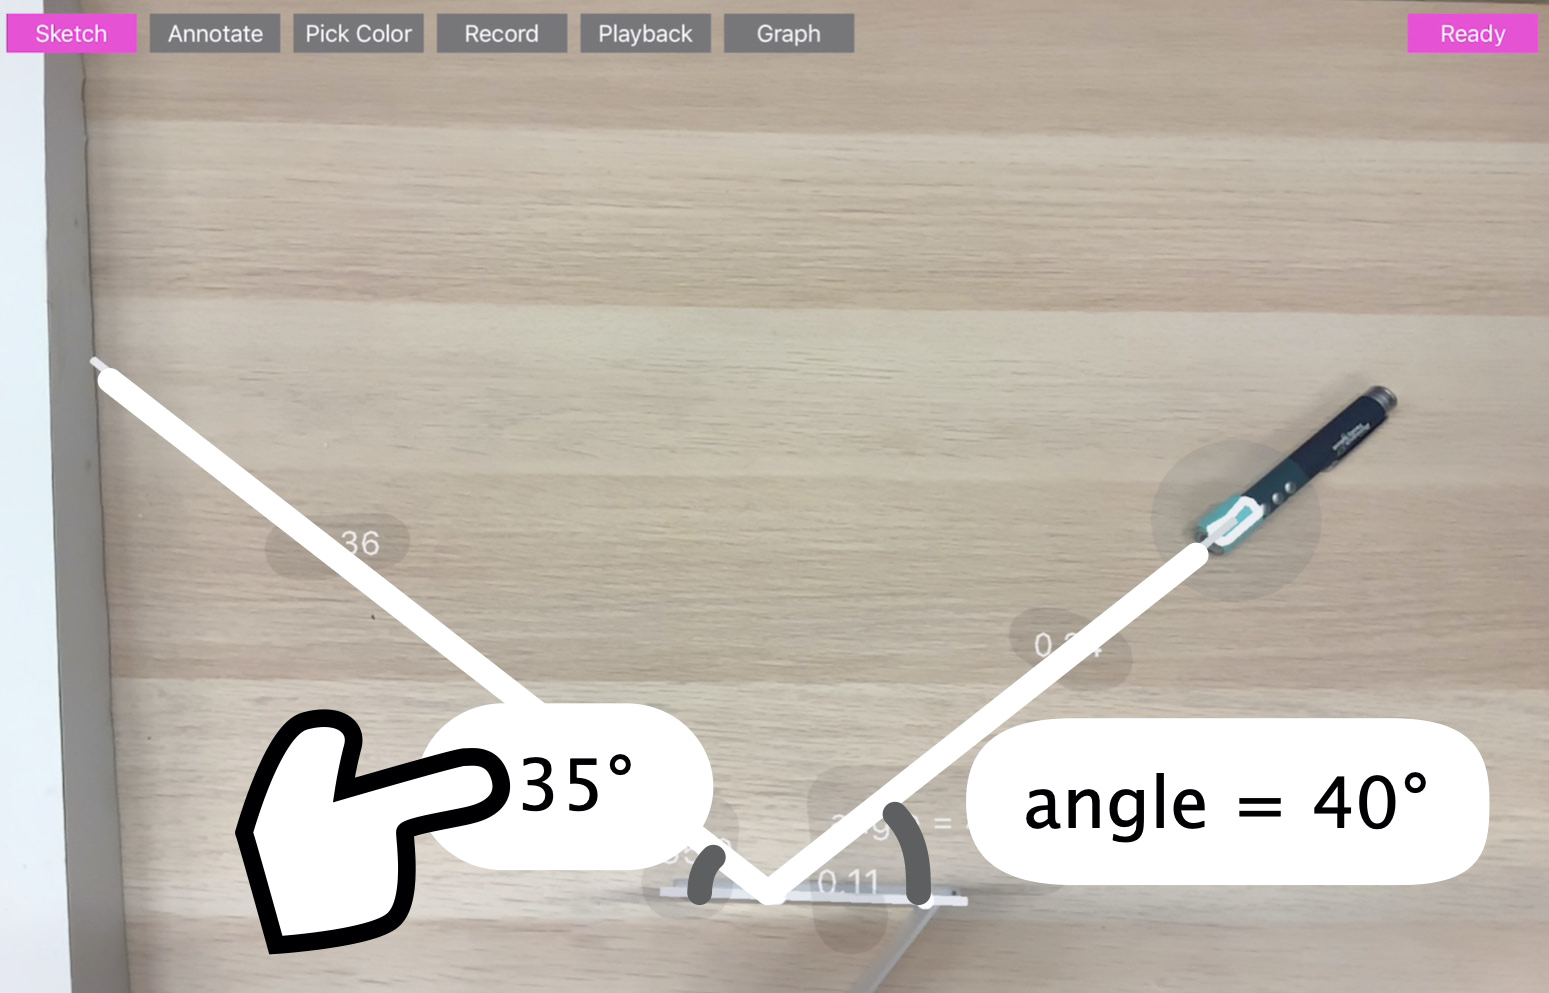
Step 3: Bind Parameters to Make Them Responsive
To make the existing line segments responsive, the user can bind variables between two elements. The parameter of a static line segment can be bound to another variable. For example, suppose the user has a variable named angle for a dynamic line segment. When the user taps the label of another angle of the static line segment, the system shows a popup to let the user enter the variable name. If the entered variable name matches an existing name, the angle of the static line segment will be dynamically bound to the existing parameter
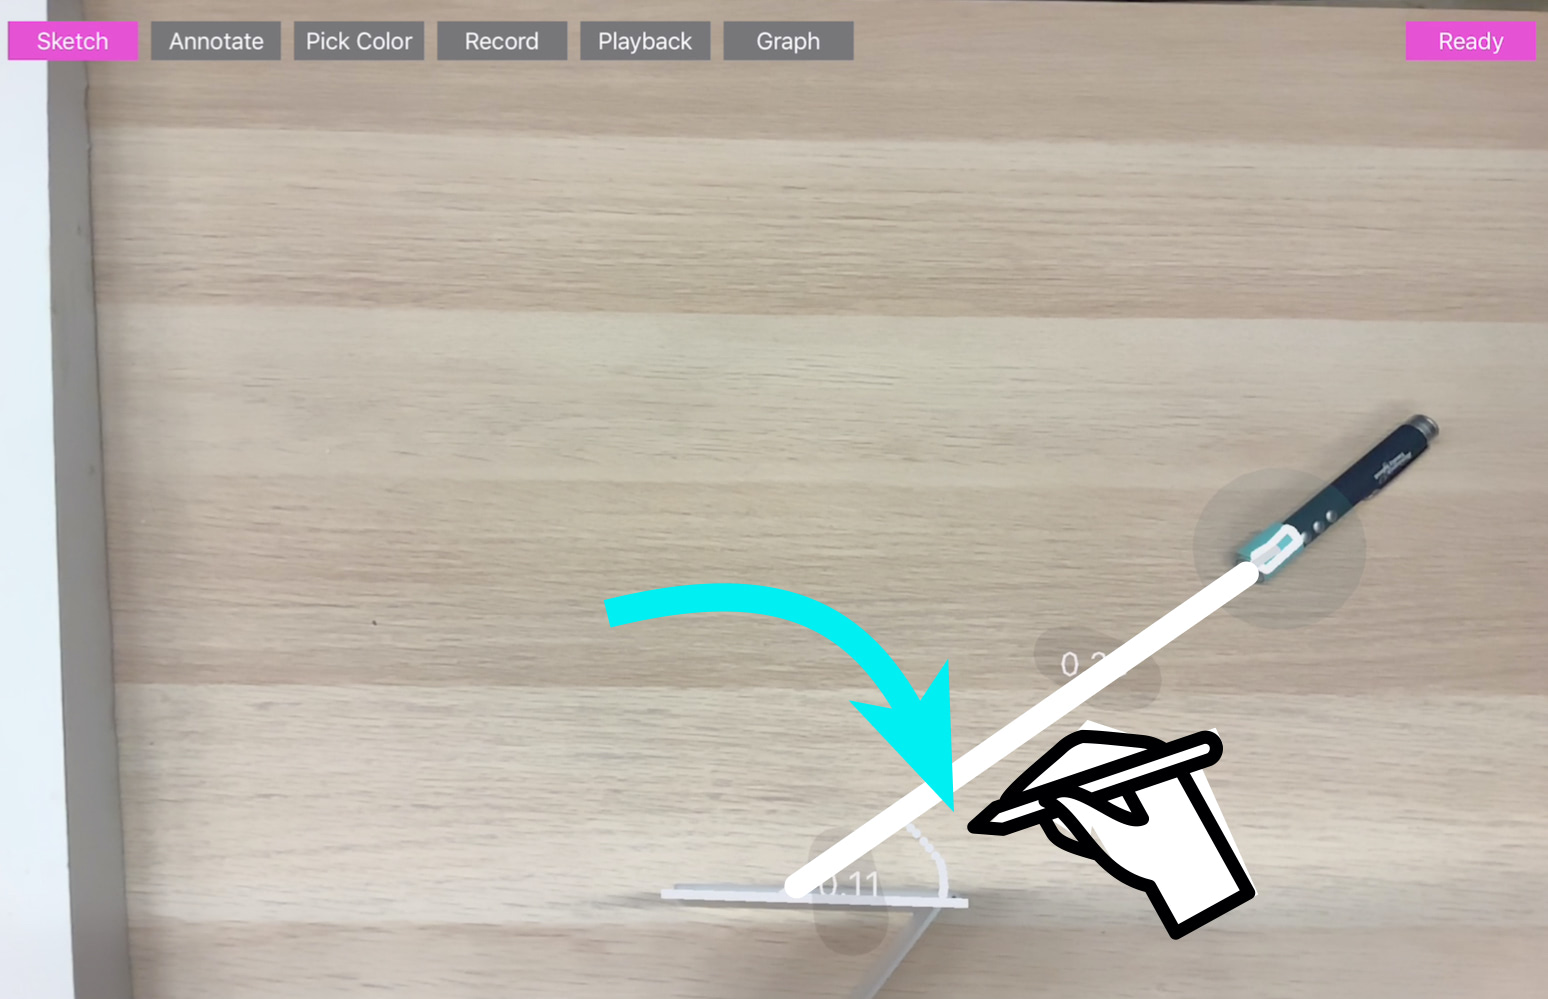
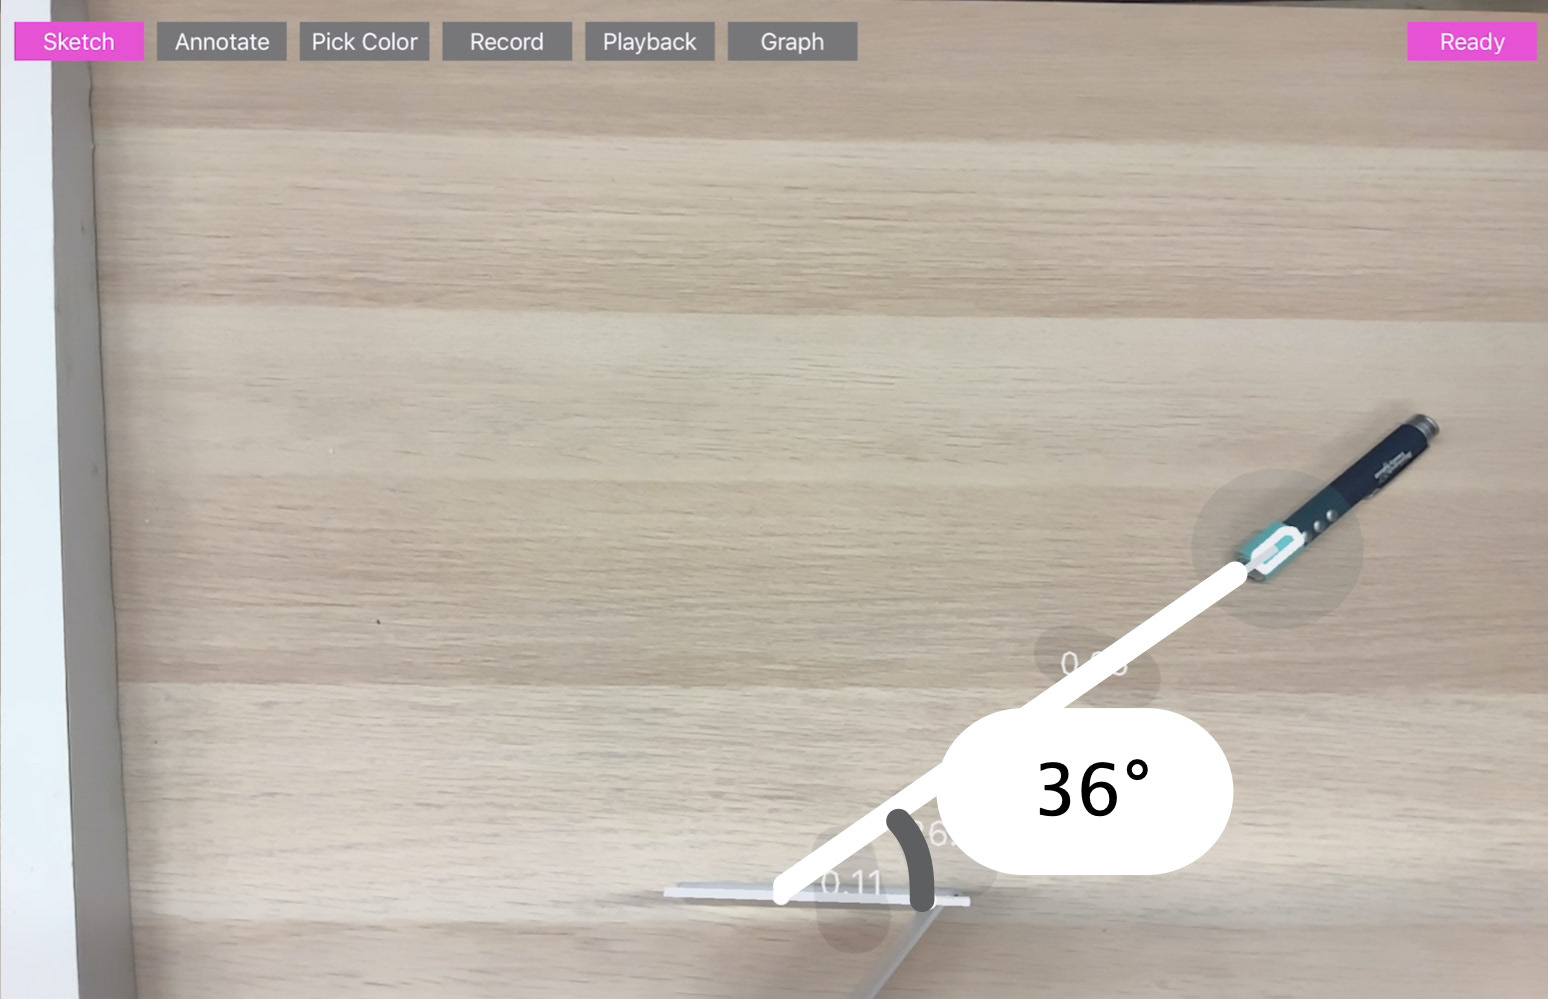
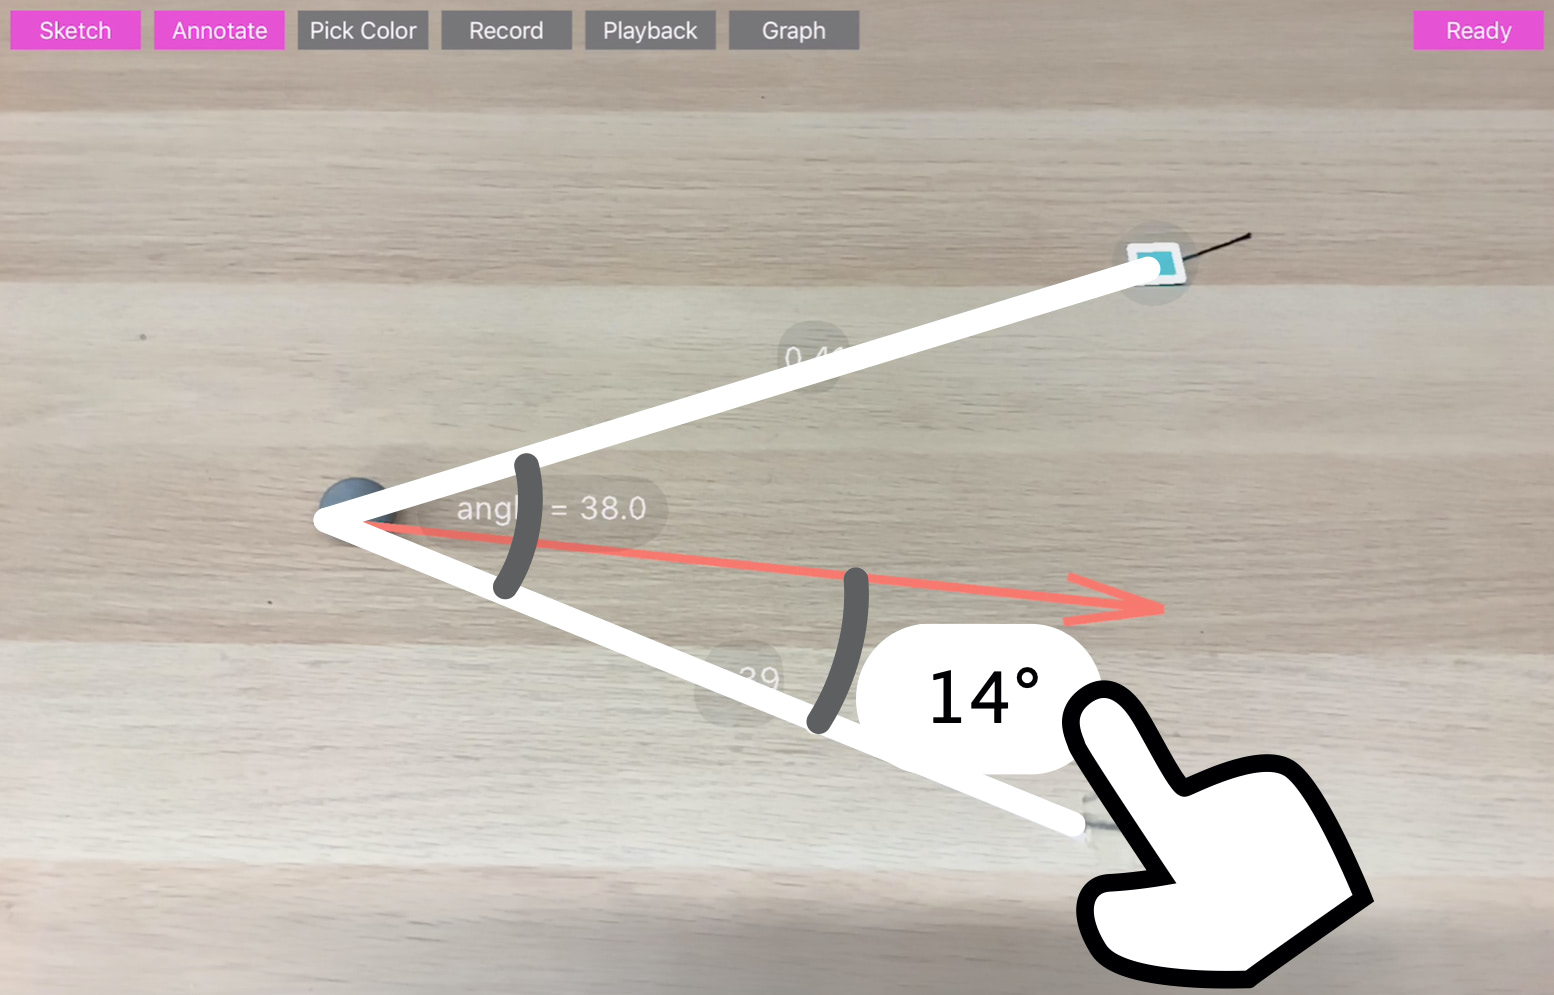
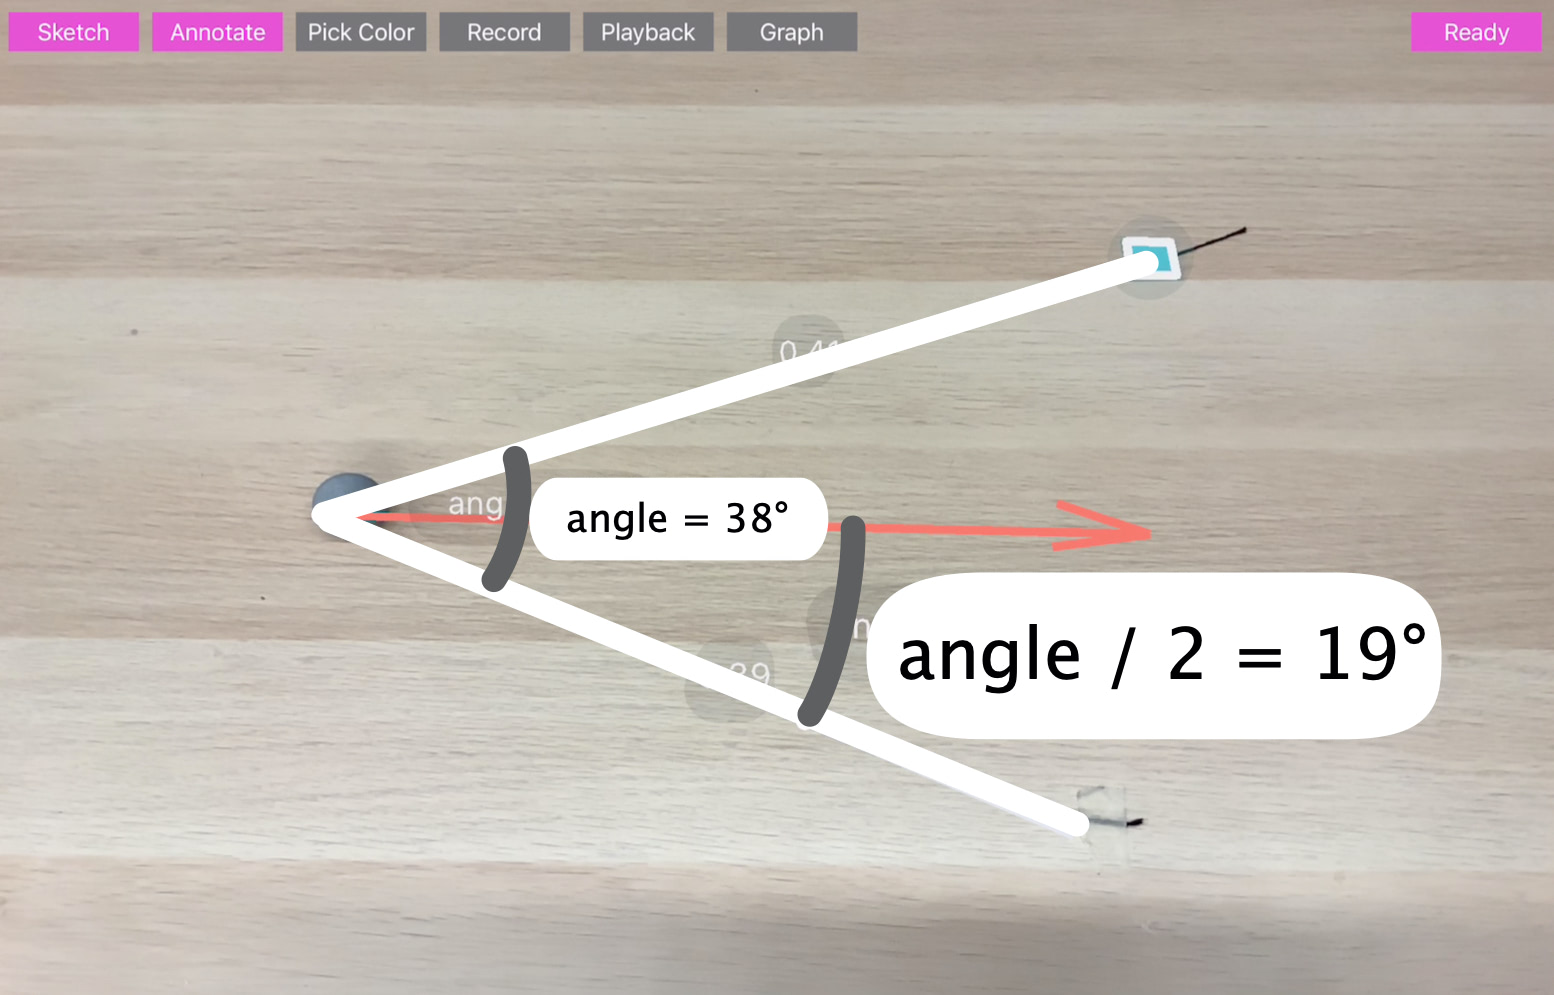
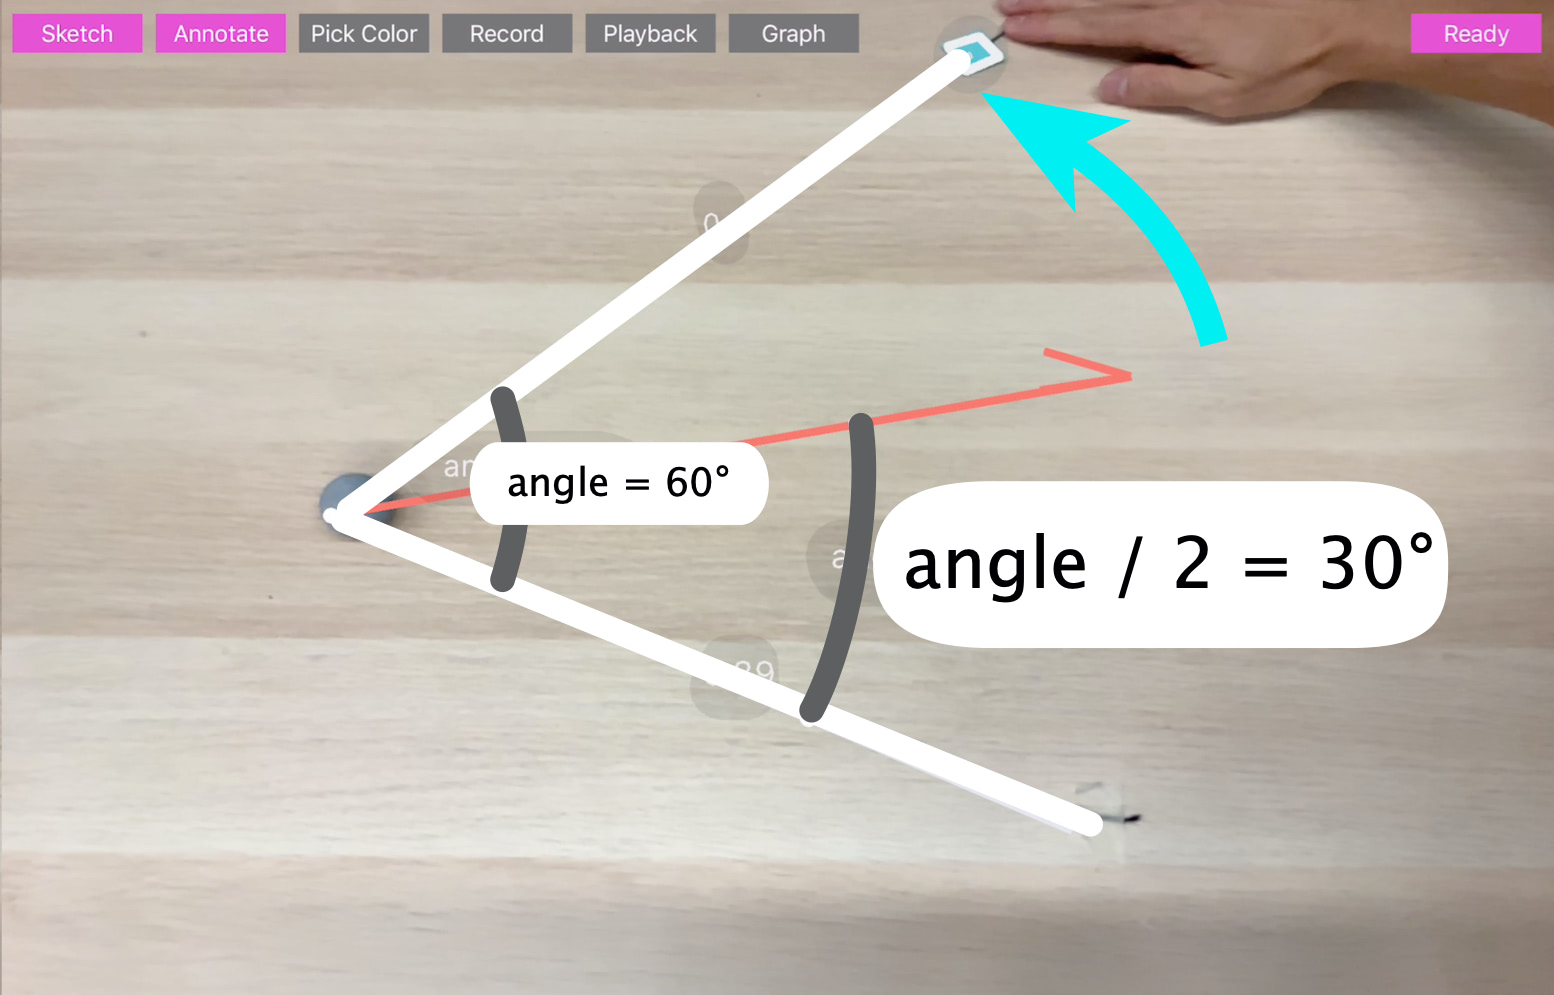
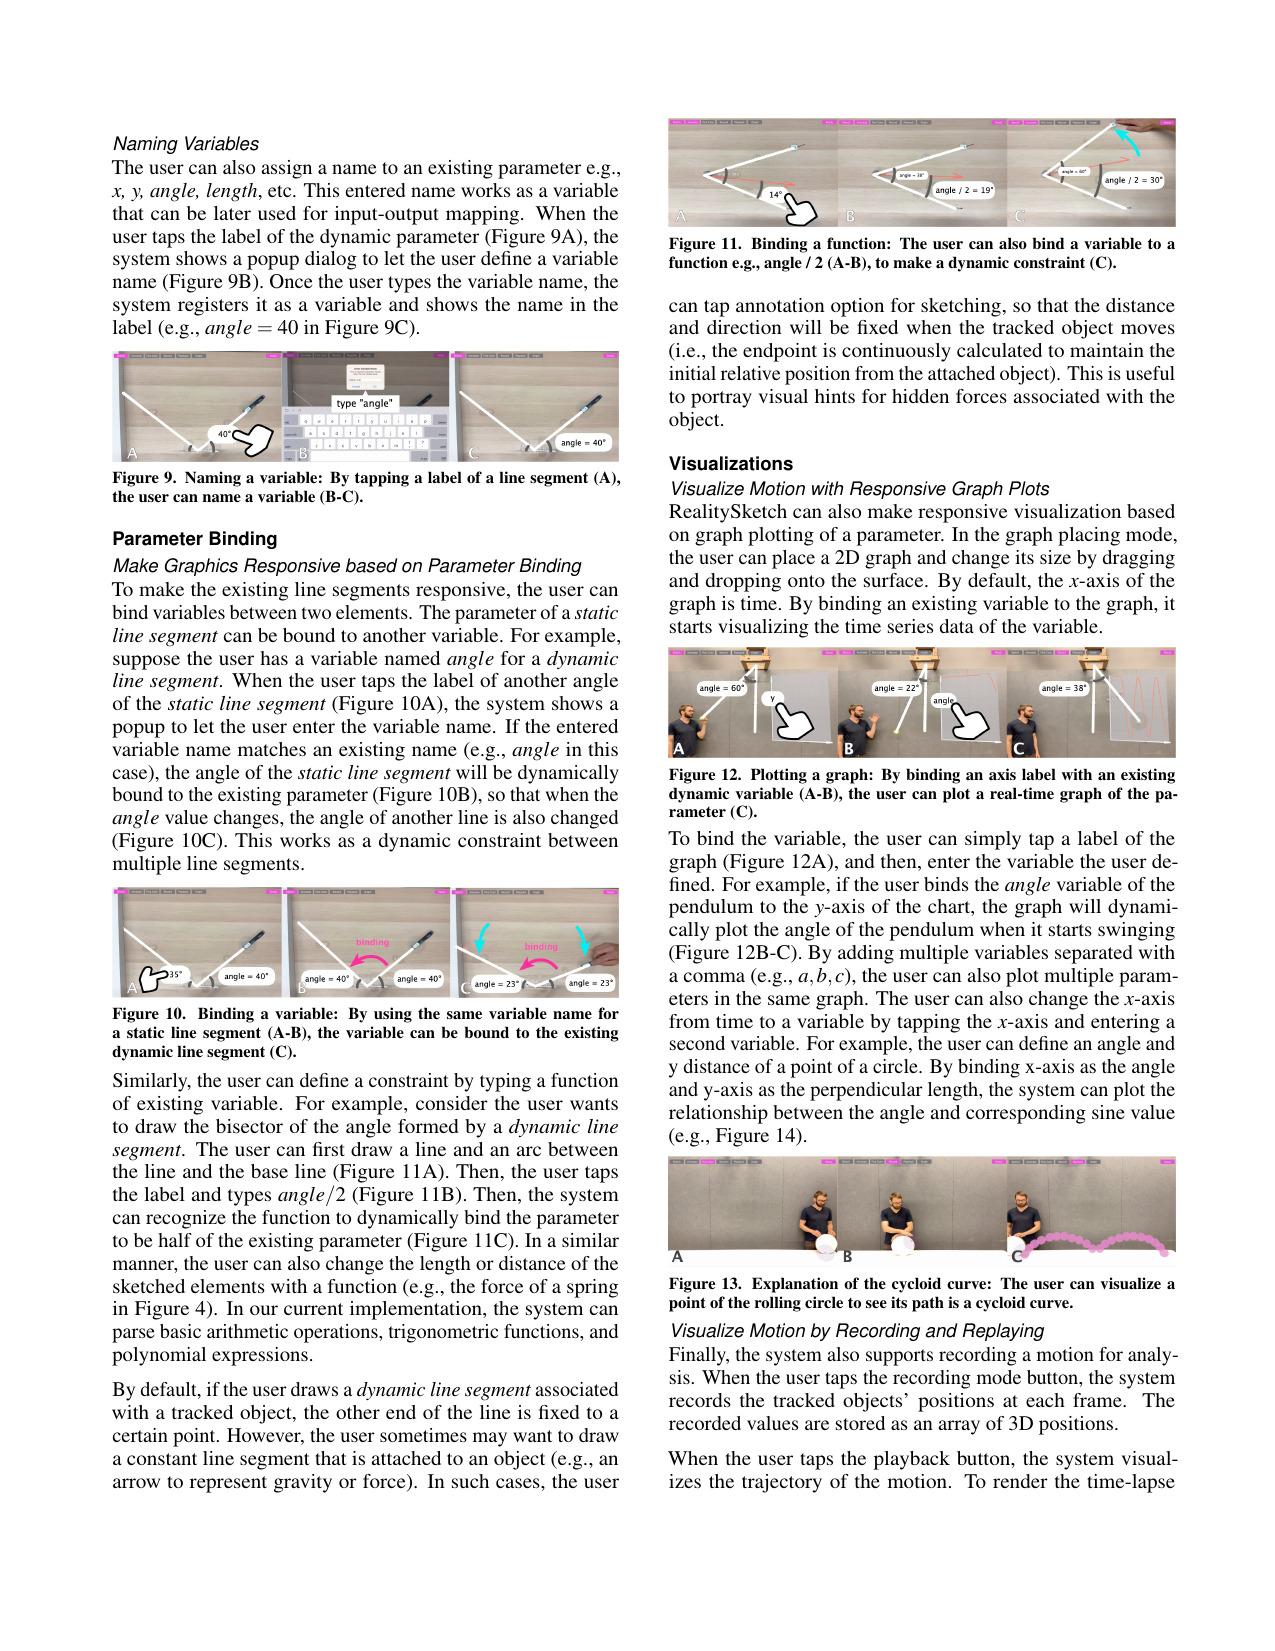
Similarly, the user can define a constraint by typing a function of an existing variable. For example, consider the user wants to draw the bisector of the angle formed by a dynamic line segment. The user can first draw a line and an arc between the line and the base line.


Step 4: Move and Animate
Rather than 2D sketches that are based on the device screen coordinates, all sketched elements have a 3D geometry and position in real world coordinates, anchored in 3D space. This way, the user can move the device to see from a different perspective and the sketches stay correctly anchored to the real objects.
To enable this functionality, our system leverages ARKit and SceneKit for both surface detection and object placement in the 3D scene.
Step 5: Record and Visualize
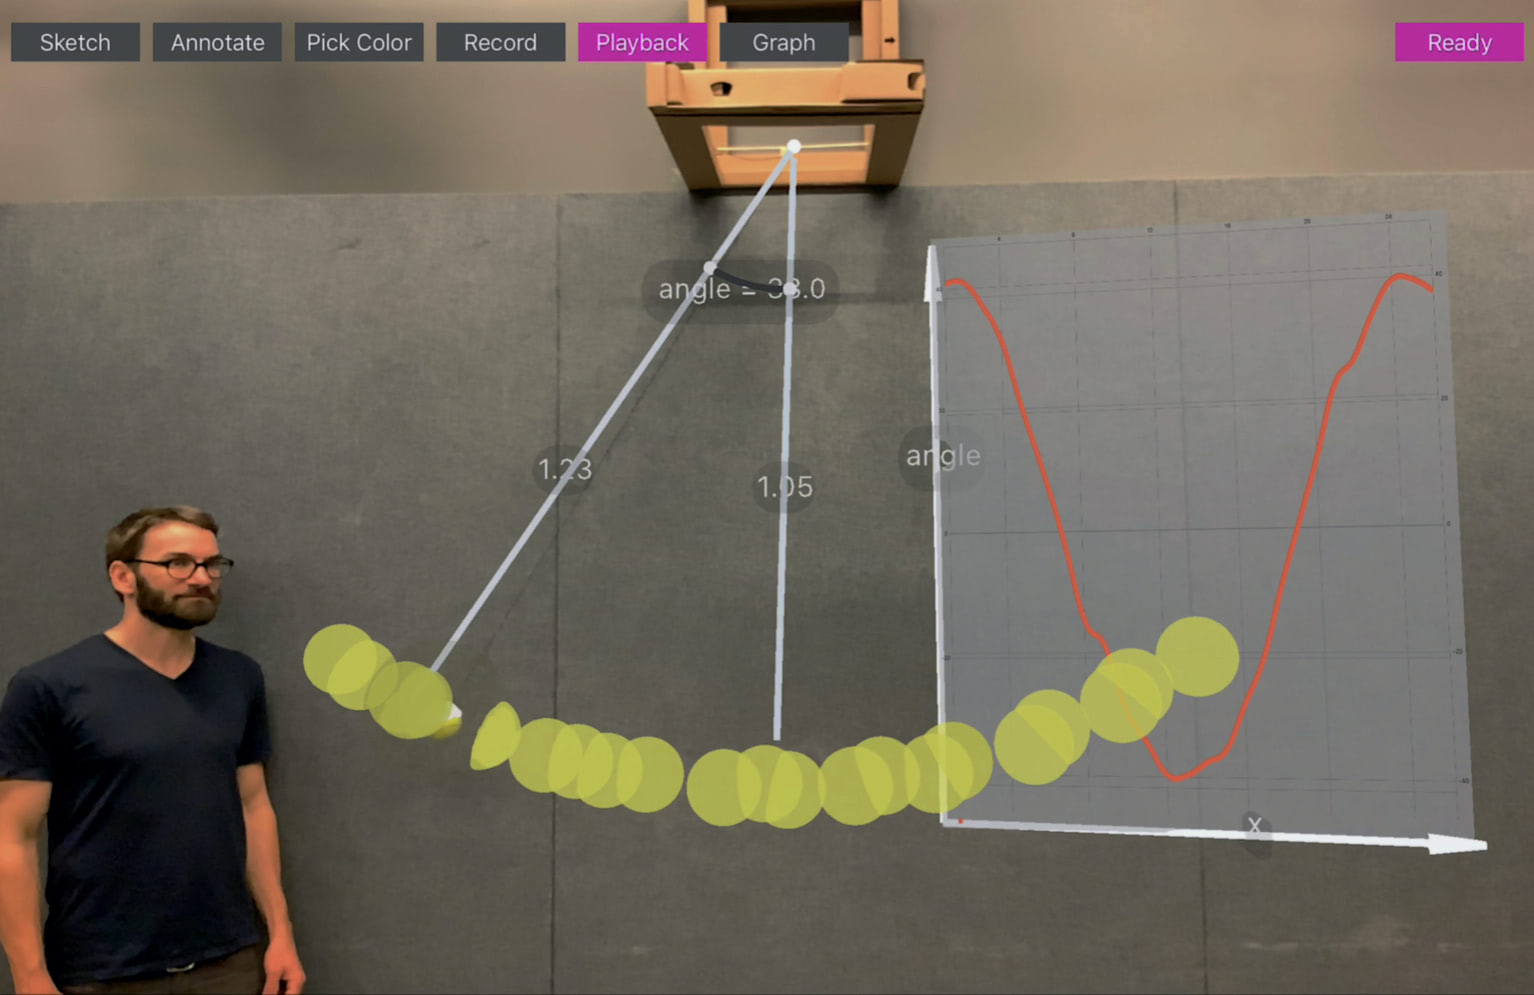
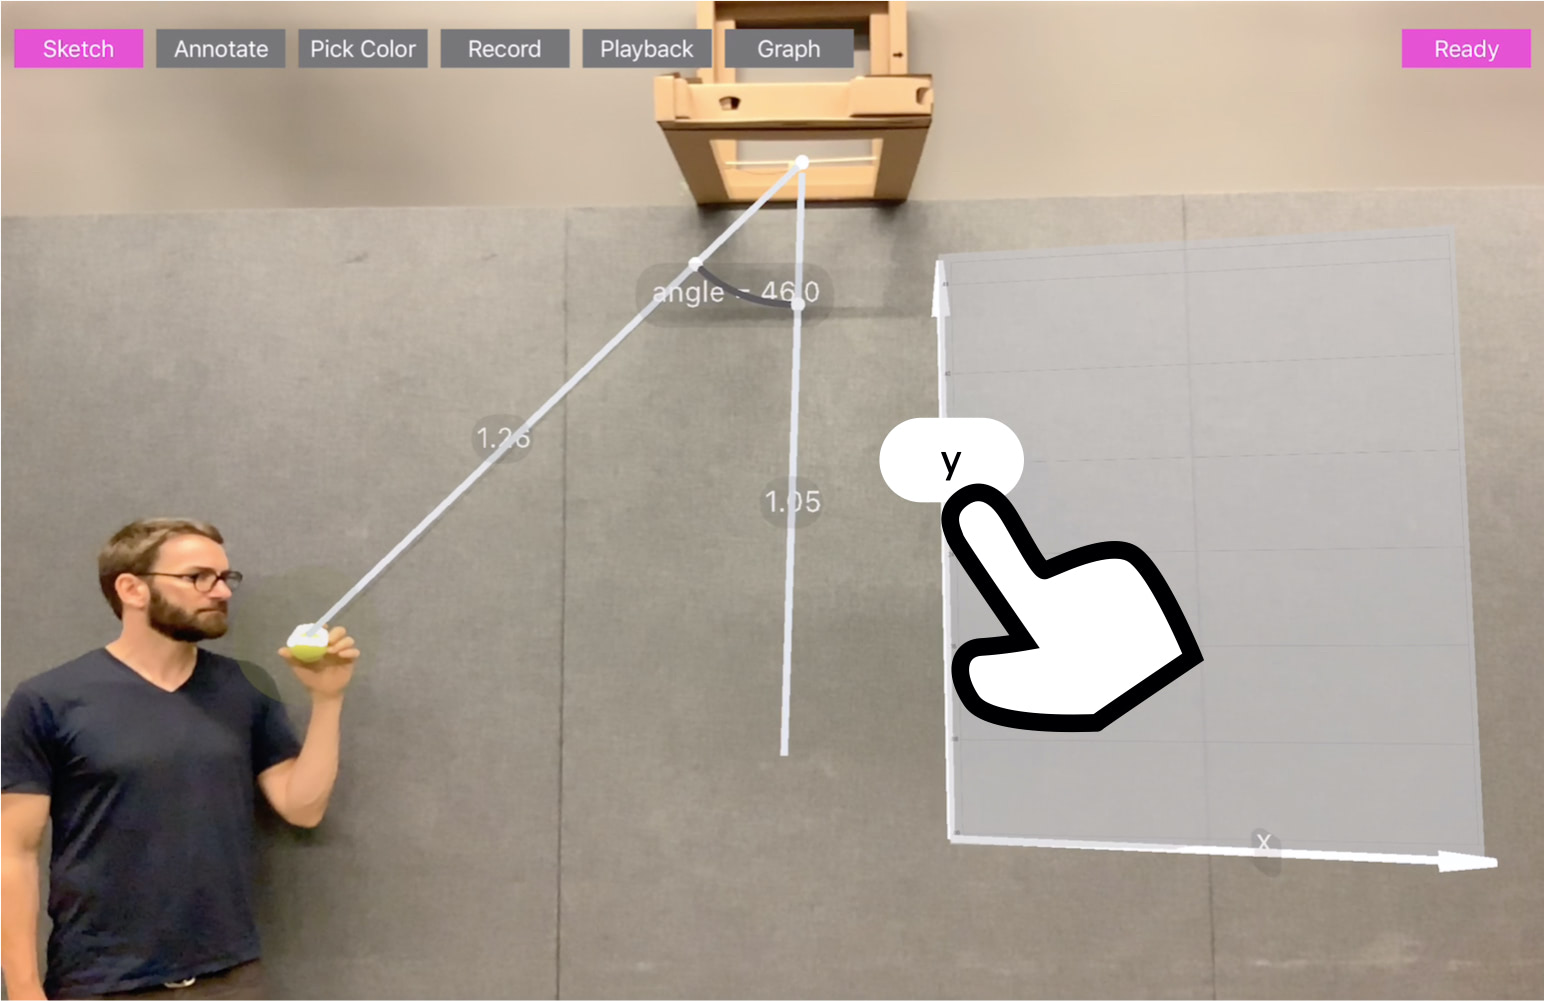
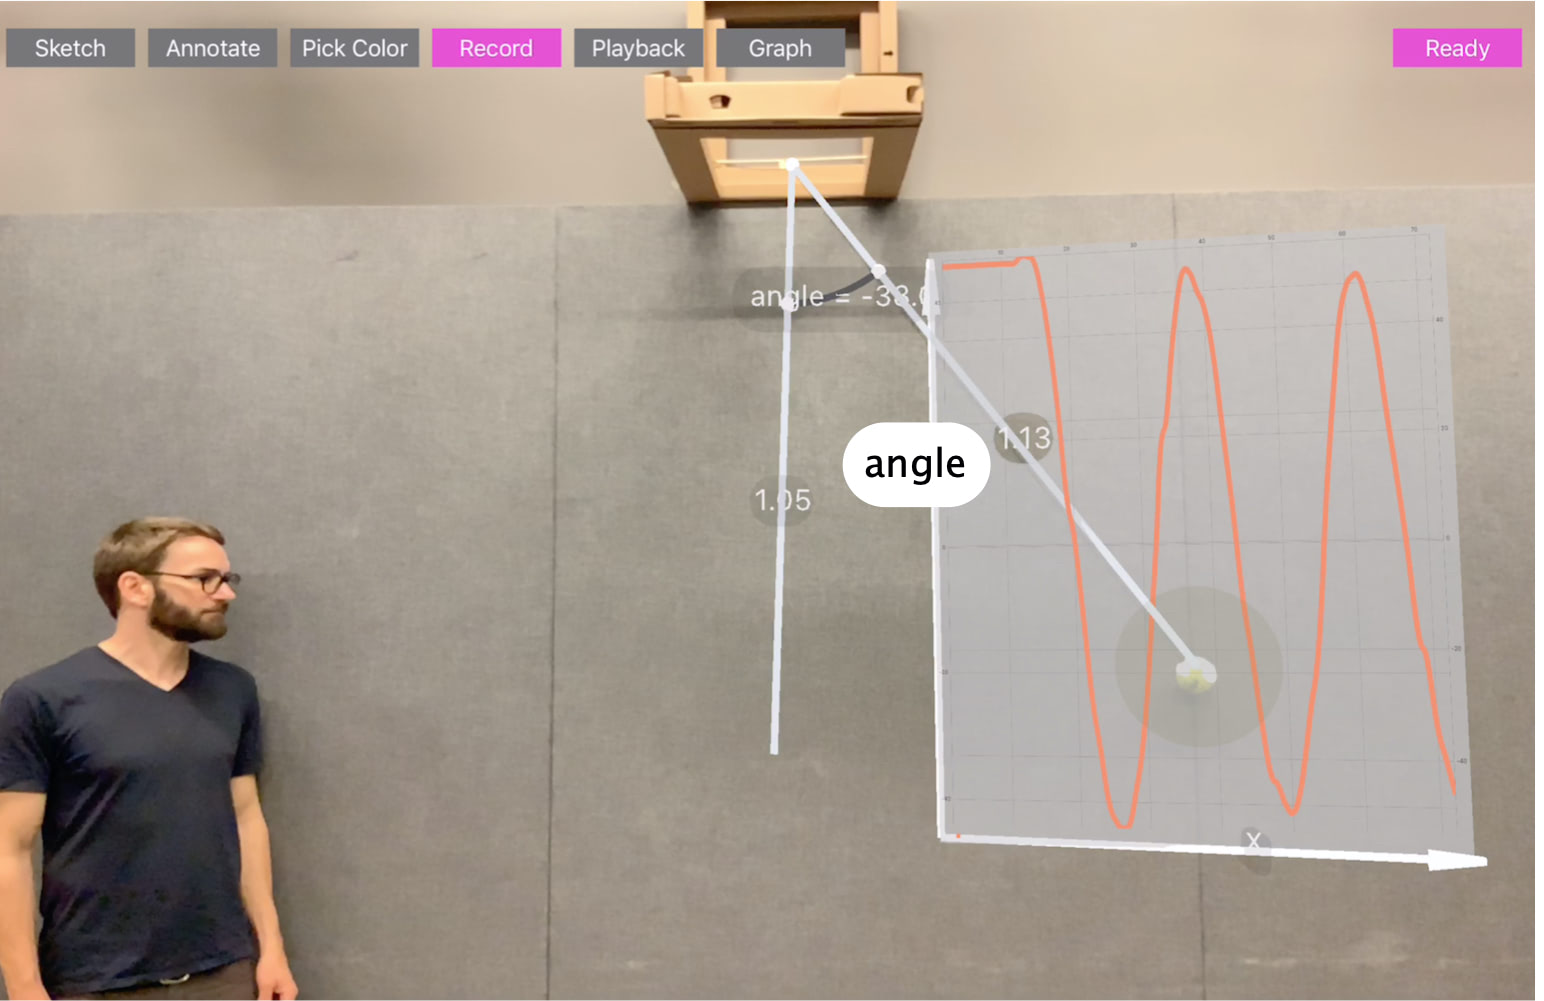
RealitySketch can also make responsive visualization based on graph plotting of a parameter. In the graph placing mode, the user can place a 2D graph and change its size by dragging and dropping onto the surface. By default, the x-axis of the graph is time. By binding an existing variable to the graph, it starts visualizing the time series data of the variable.
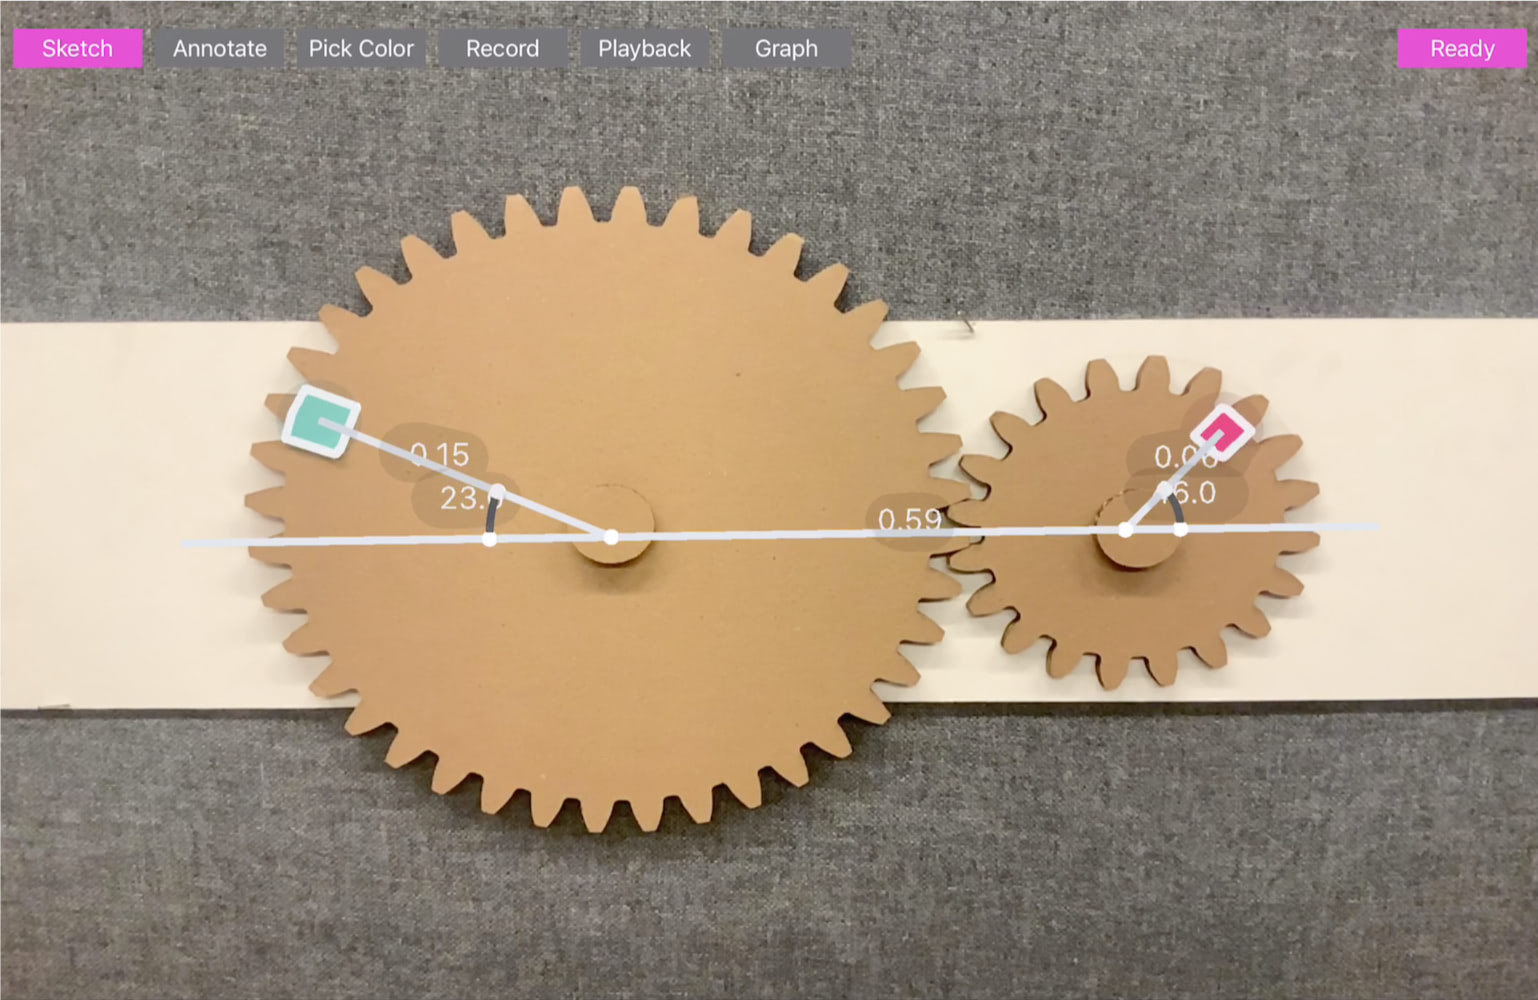
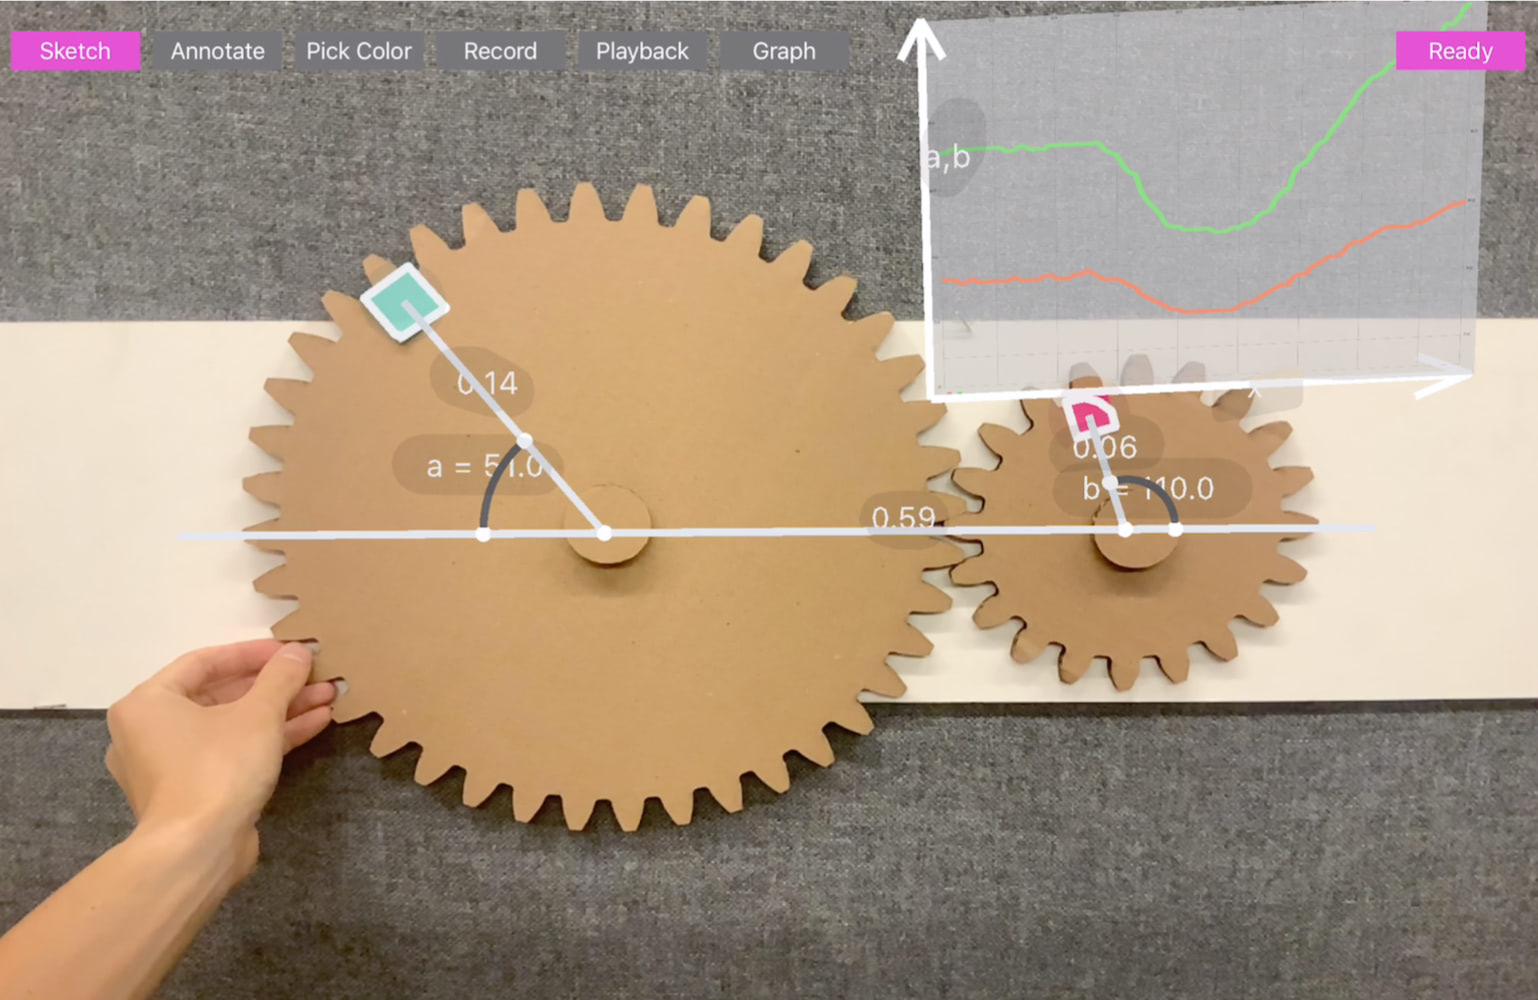
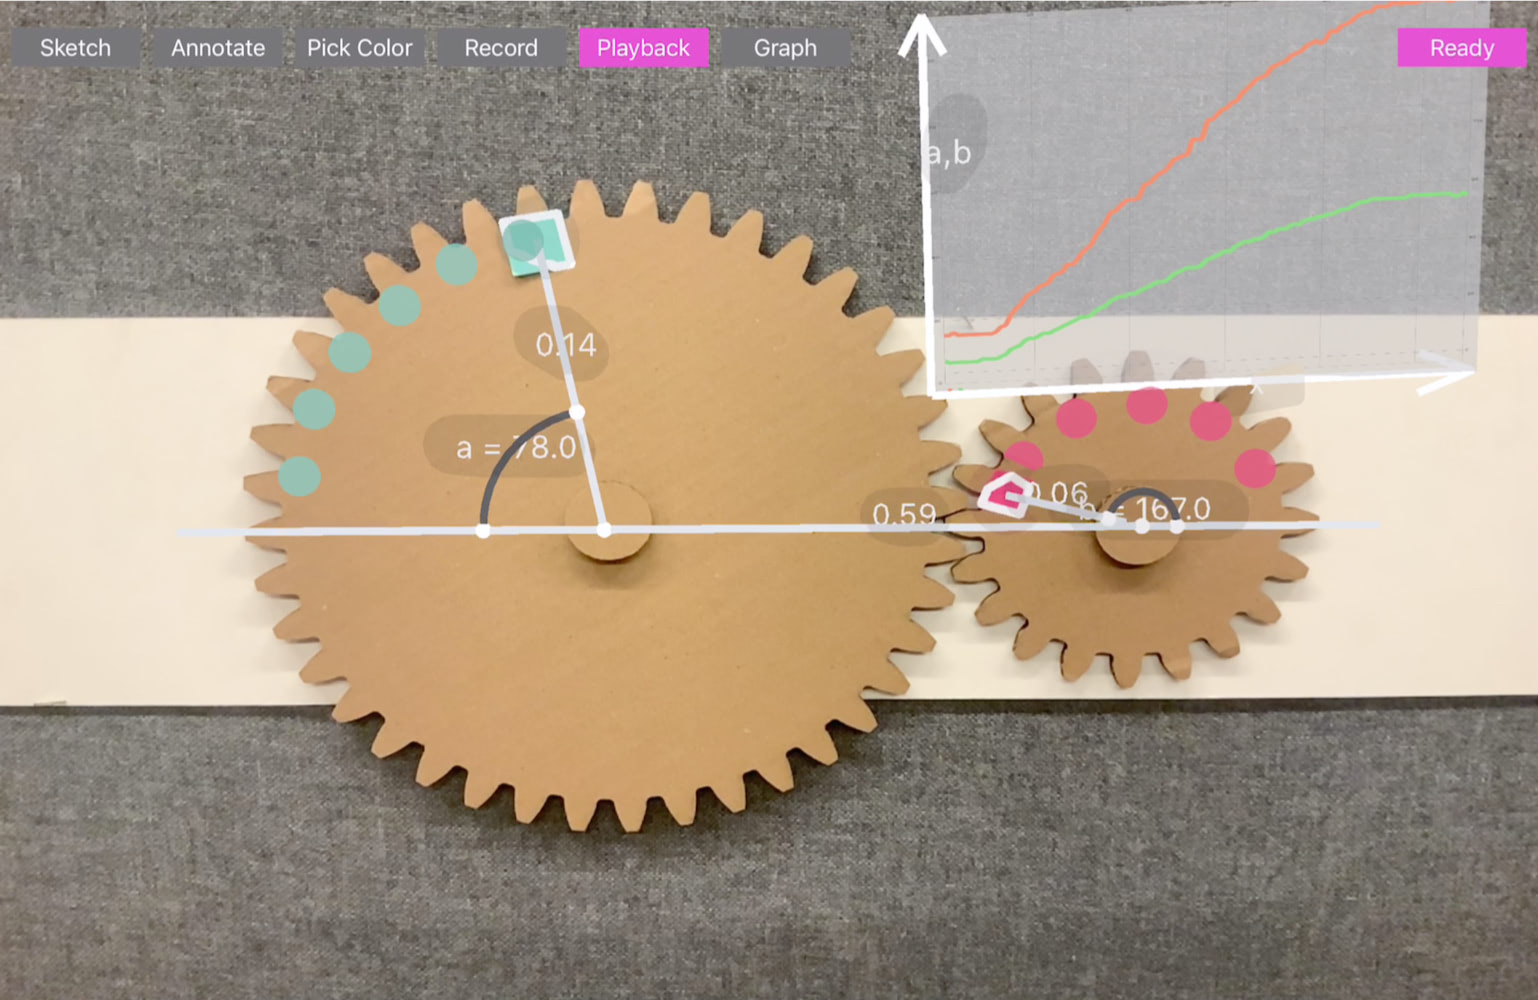
To bind the variable, the user can simply tap a label of the graph, and then, enter the variable the user-defined. For example, if the user binds the angle variable of the pendulum to the y-axis of the chart, the graph will dynamically plot the angle of the pendulum when it starts swinging. By adding multiple variables separated with a comma (e.g., a,b,c), the user can also plot multiple parameters in the same graph. The user can also change the x-axis from time to a variable by tapping the x-axis and entering a second variable. For example, the user can define an angle and y distance of a point of a circle. By binding x-axis as the angle and y-axis as the perpendicular length, the system can plot the relationship between the angle and corresponding sine value.


Application Scenarios
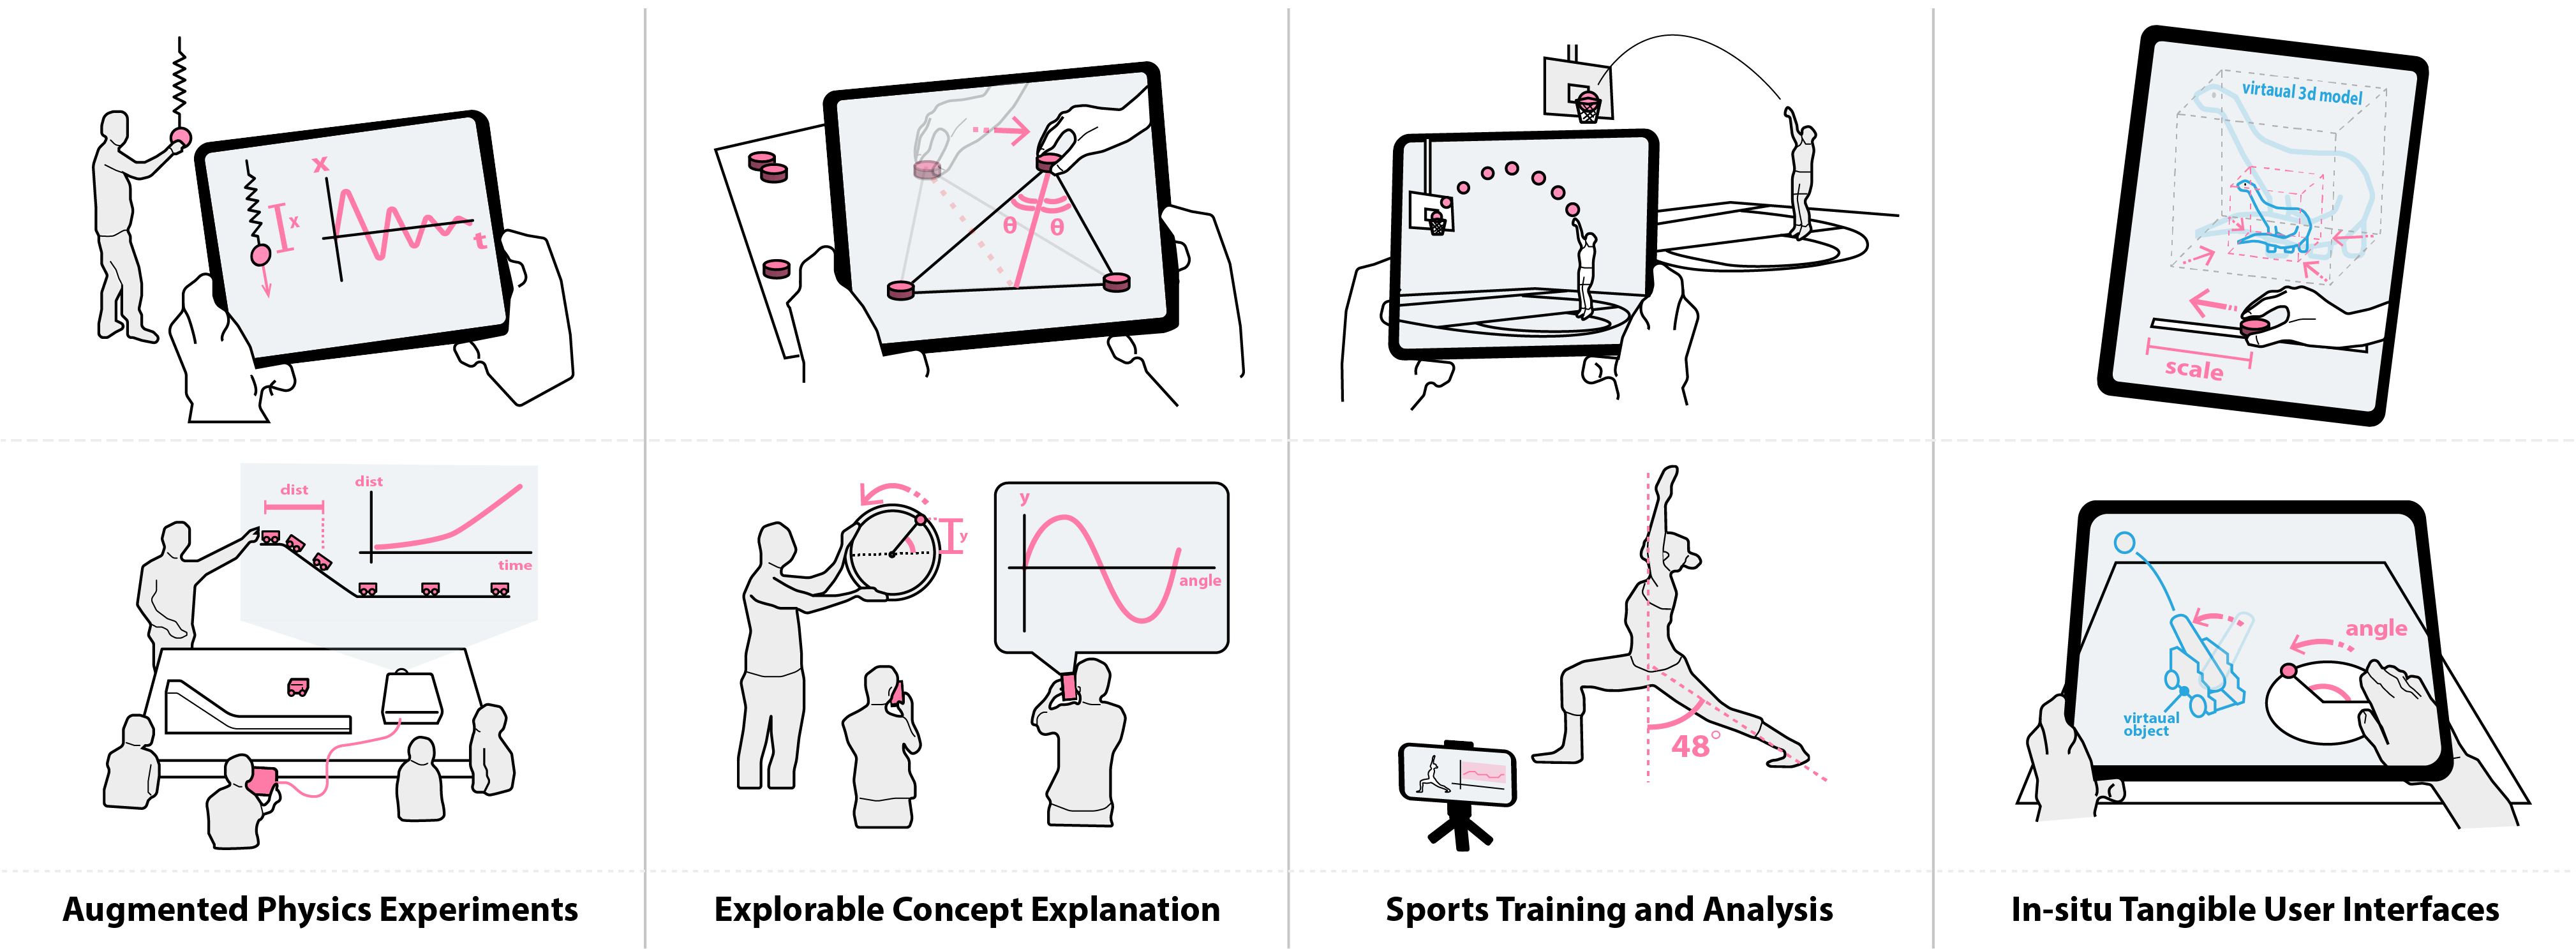
We have explored and demonstrated the following application scenarios
- Augmented Physics Experiments
- Interactive and Explorable Concept Explanation
- Improvised Visualization for Sports and Exercises
- In-situ Tangible User Interfaces
Application 1: Augmented Physics Experiments
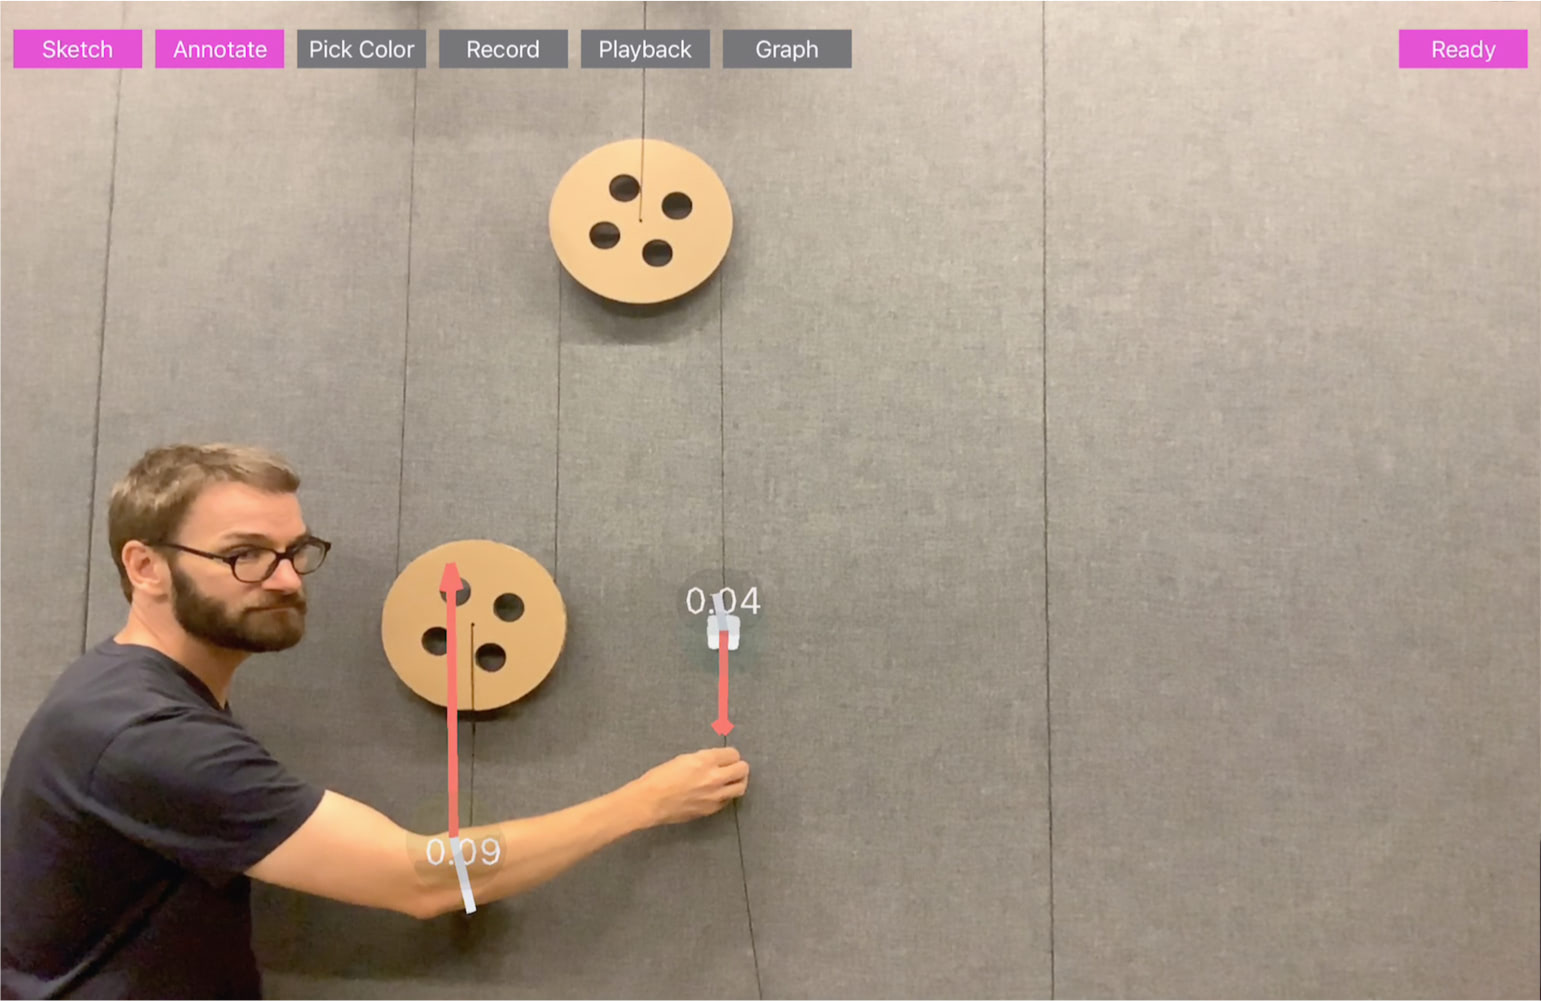
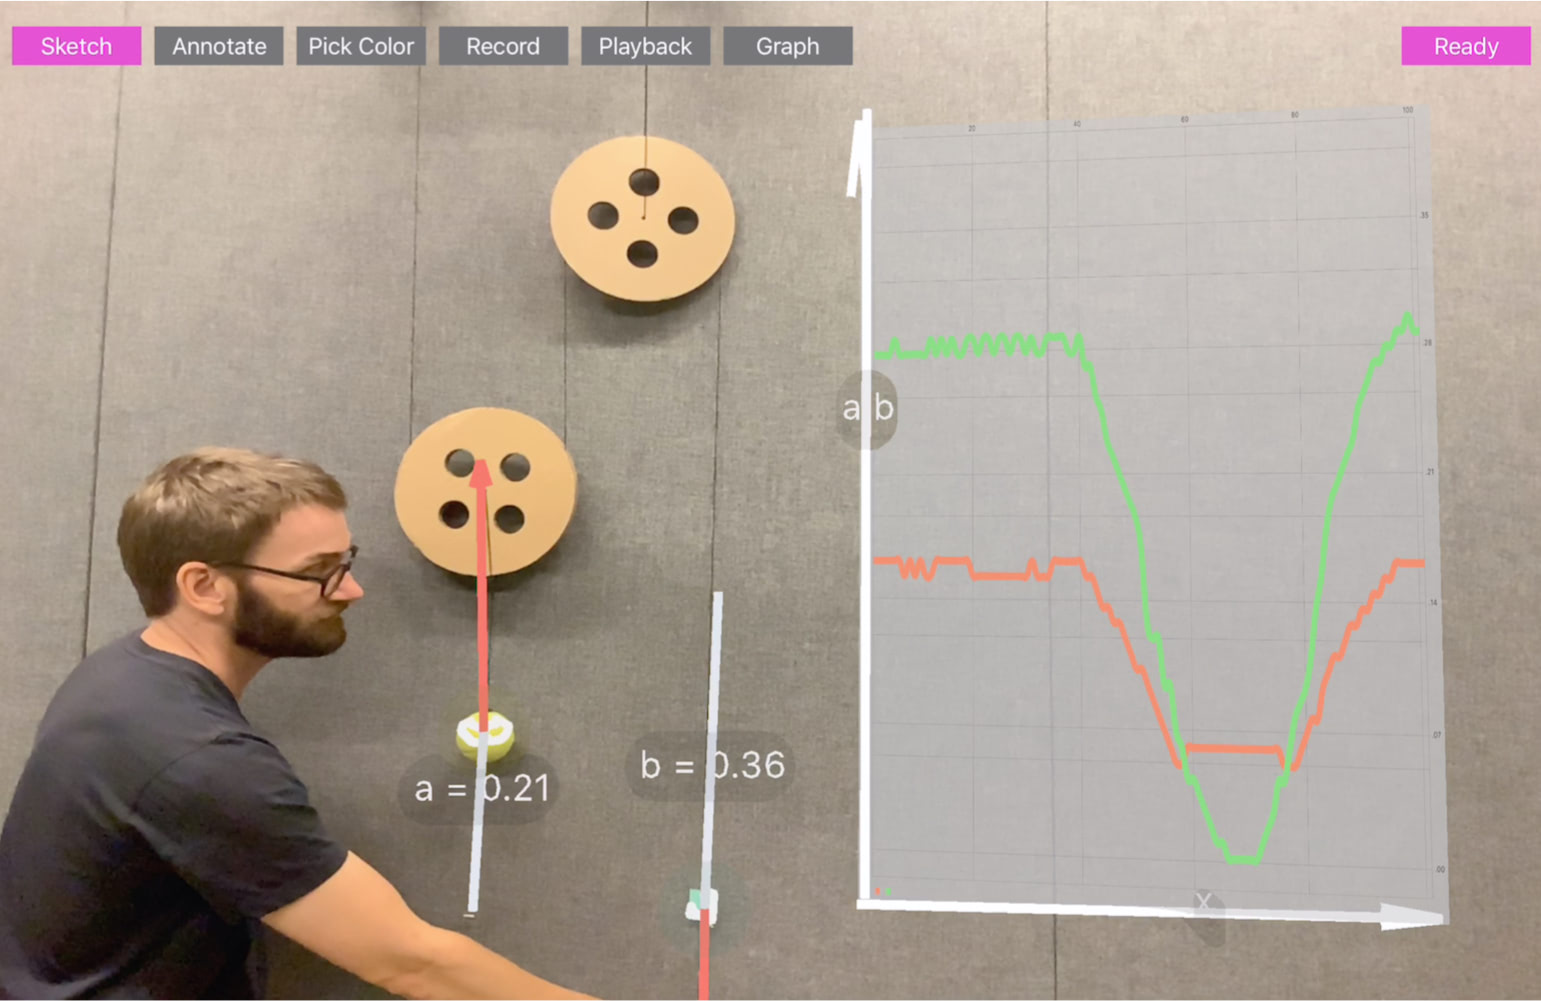
In science education, a classroom experiment is an integral part of learning physics because the real-world experiment provides students an opportunity to connect their knowledge with physical phenomena. RealitySketch can become a powerful tool to support these experiments by leveraging real-time visualization capability. Figure 15 illustrates how our tool can help students understand the pulley system. In this scenario, by tracking the movement of two points (i.e., the point of the person grabs and the point of the load), the students can visualize the traveling distance of each point. In this way, they can see the load distance movement is shorter than the distance the person pulls.

Application 2: Interactive and Explorable Concept Explanation
RealitySketch is also useful to help teachers explain concepts that may be difficult to understand with static graphs, and to let students explore them through tangible interactions. Some examples are shown in the above Figure (Top: demonstrating an area of a triangle remains the same with horizontal movement; a bisector line of a triangle always intersect at the middle point. Bottom: showing how a sine curve is generated from plotting the angle and perpendicular distance of a rotating point.)
For educational applications, we can think of the following three setups of how students and teachers can use our tool:
Classroom presentation: In this case, a teacher or an assistant sketches and visualizes the motion, which can be shared through a connected large display or projector, so that the students can see and understand.
Collaborative learning: In this case, students can form a group and interact with their own devices. Since mobile AR is accessible for almost all smartphones, every student should be able to play by themselves, which can lead to an interesting exploration and discoveries.
Remote learning: In this case, a teacher only records the video of the experiment, then share the recorded video with the students. The student can download and visualize with their own app, so that it provides a fun and interactive experiment to support online and remote learning.
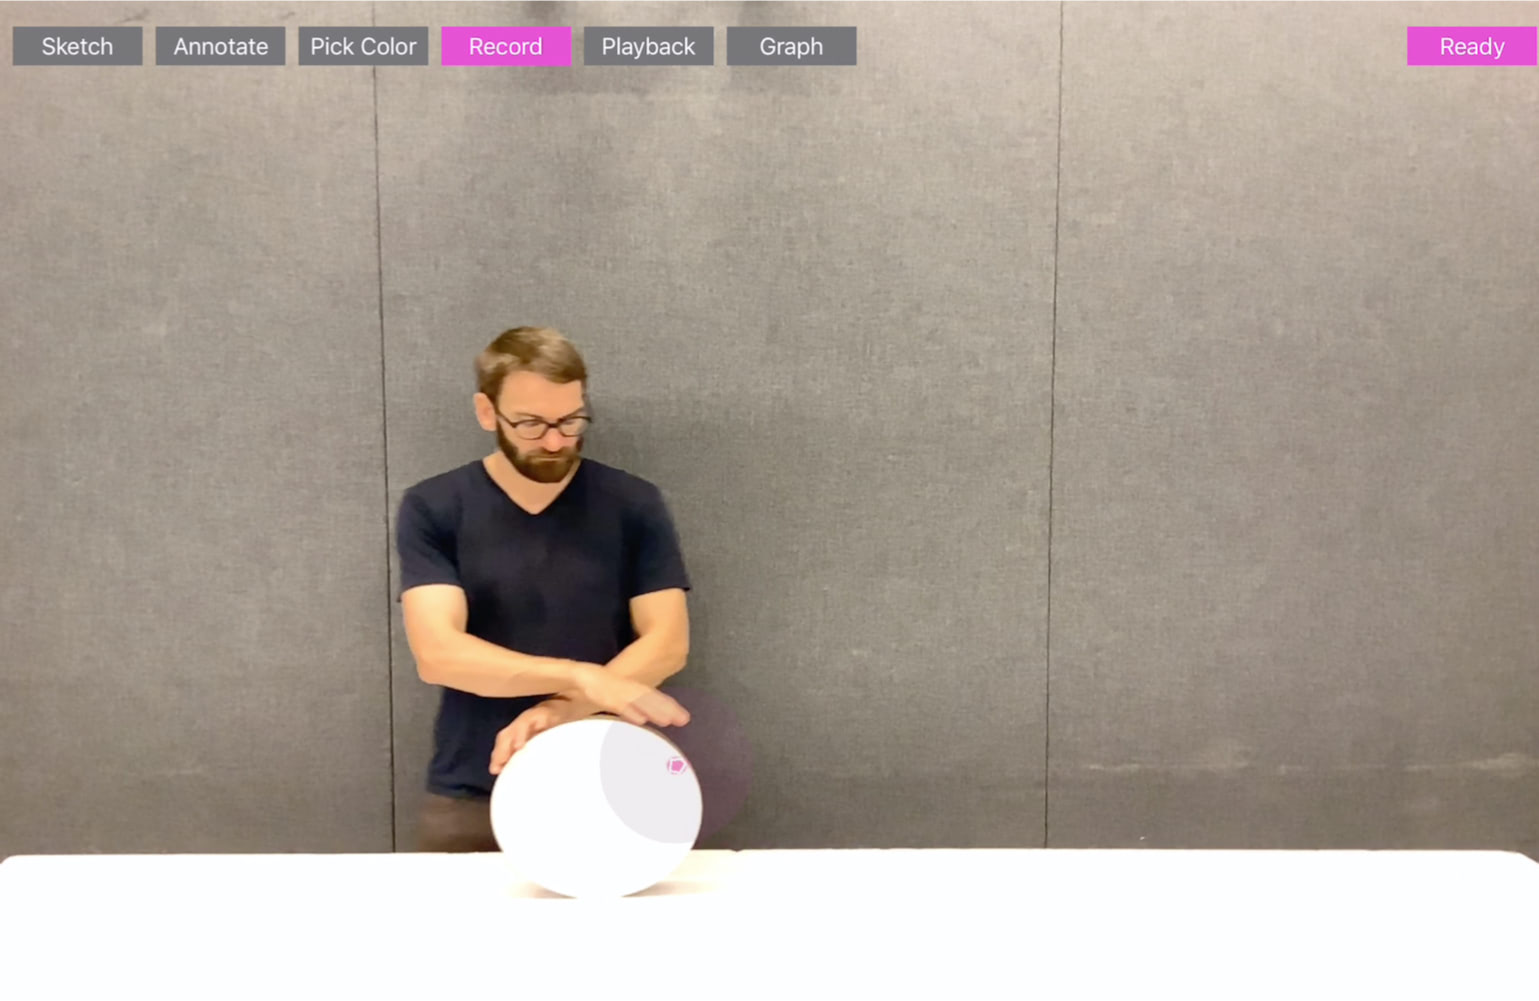

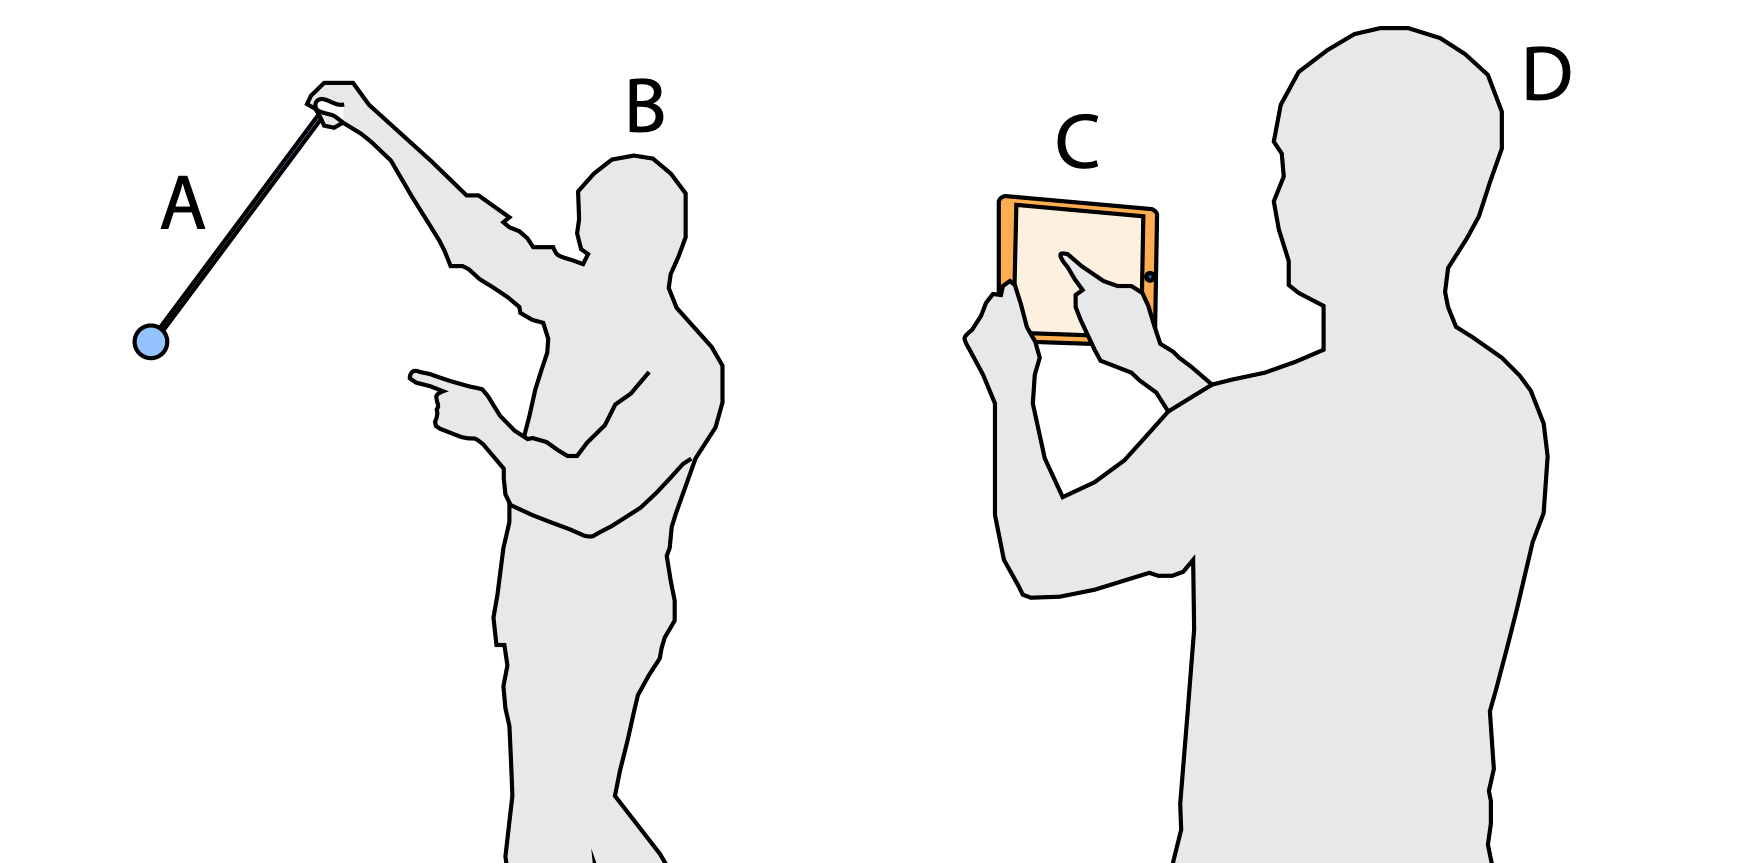
Application 3: Improvised Visualization for Sports and Exercises
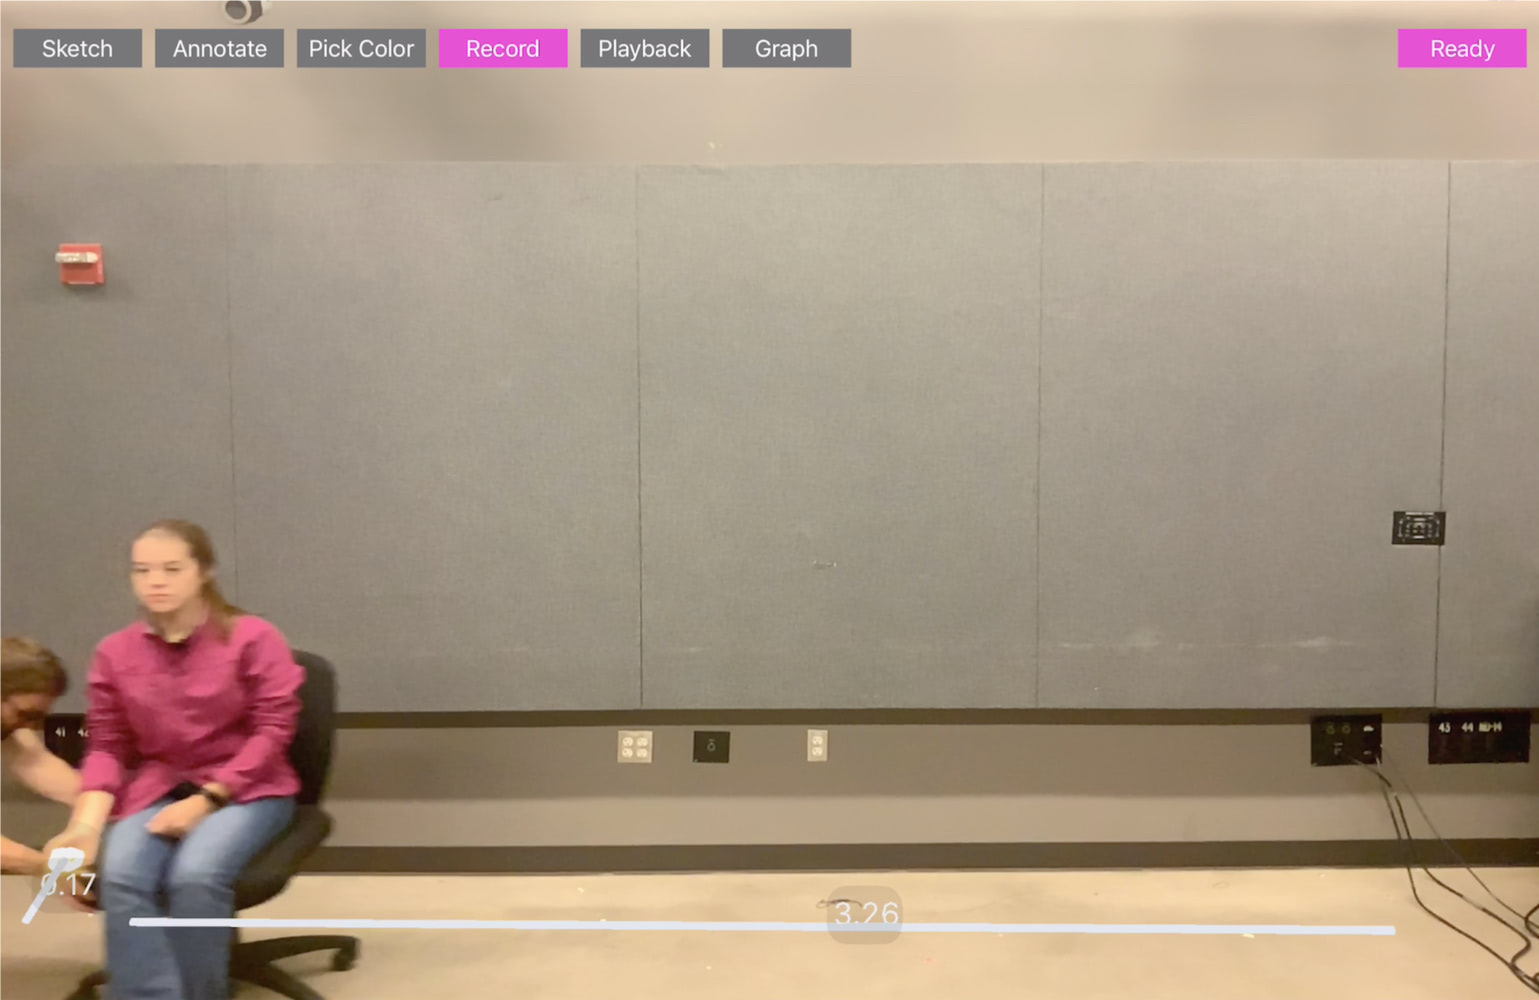
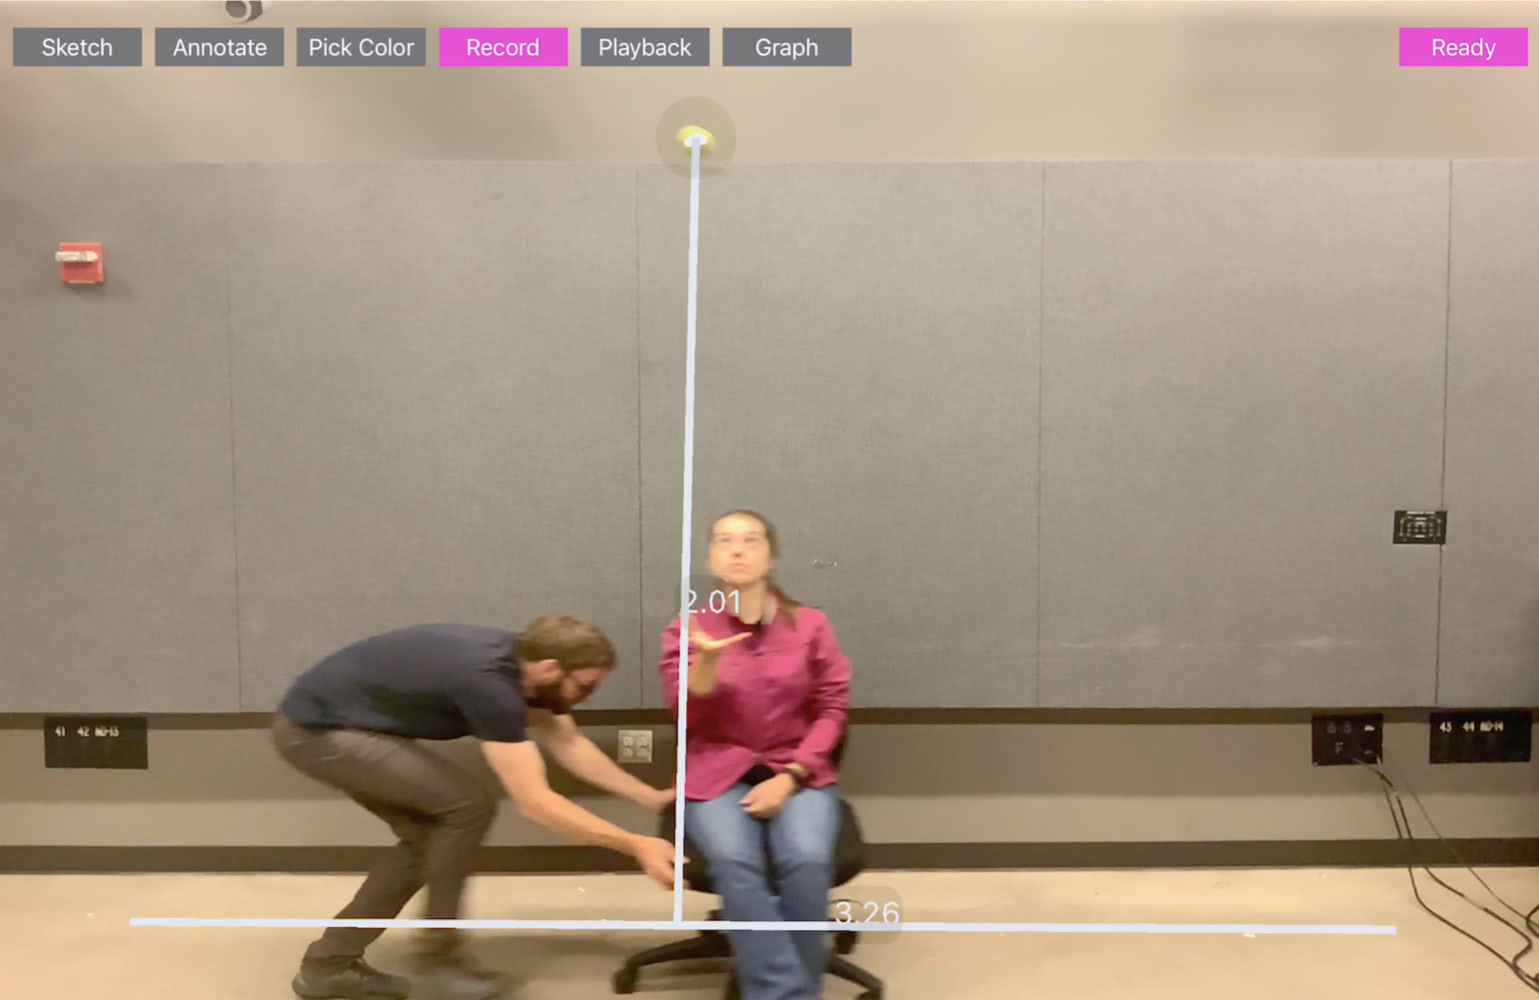
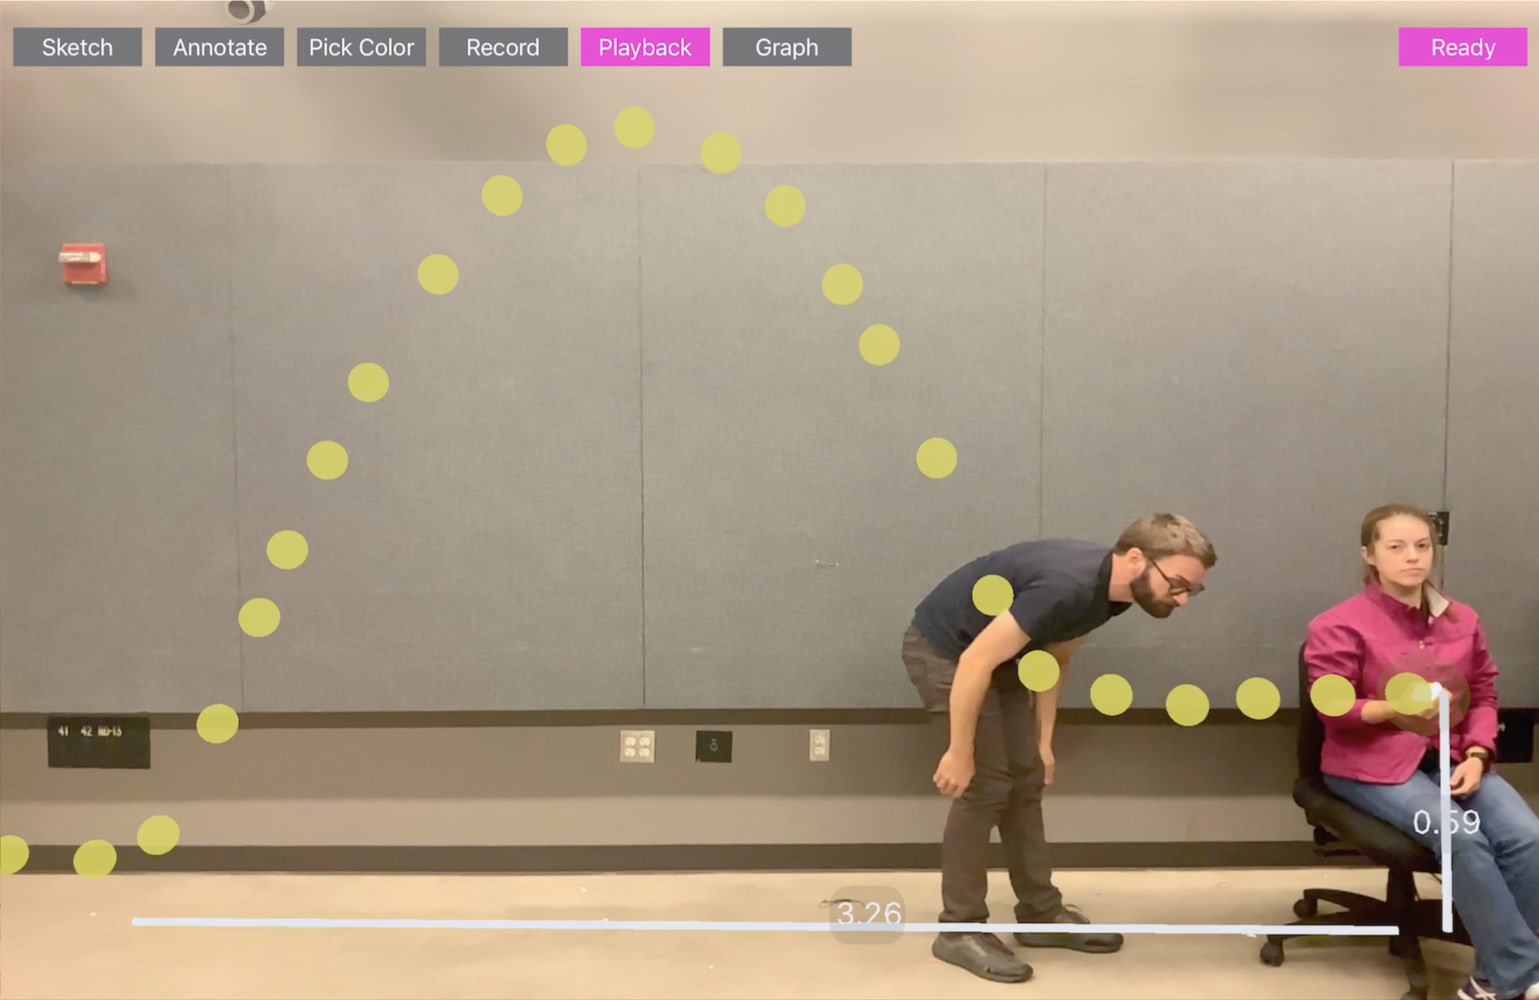
RealitySketch could be also useful to analyze and visualize the motion for sports training and exercises because they often employ the physical movements. For example, sports practices, like a golf shot, baseball pitching, and basketball shooting, would be an interesting example to visualize the trajectory of the ball. Similar to the previous example of showing the trajectory of a ball, it is useful to quickly see the path through stroboscopic effects. In addition to showing the trajectory, the system can also capture and compare multiple attempts to let the user analyze what works and what does not.
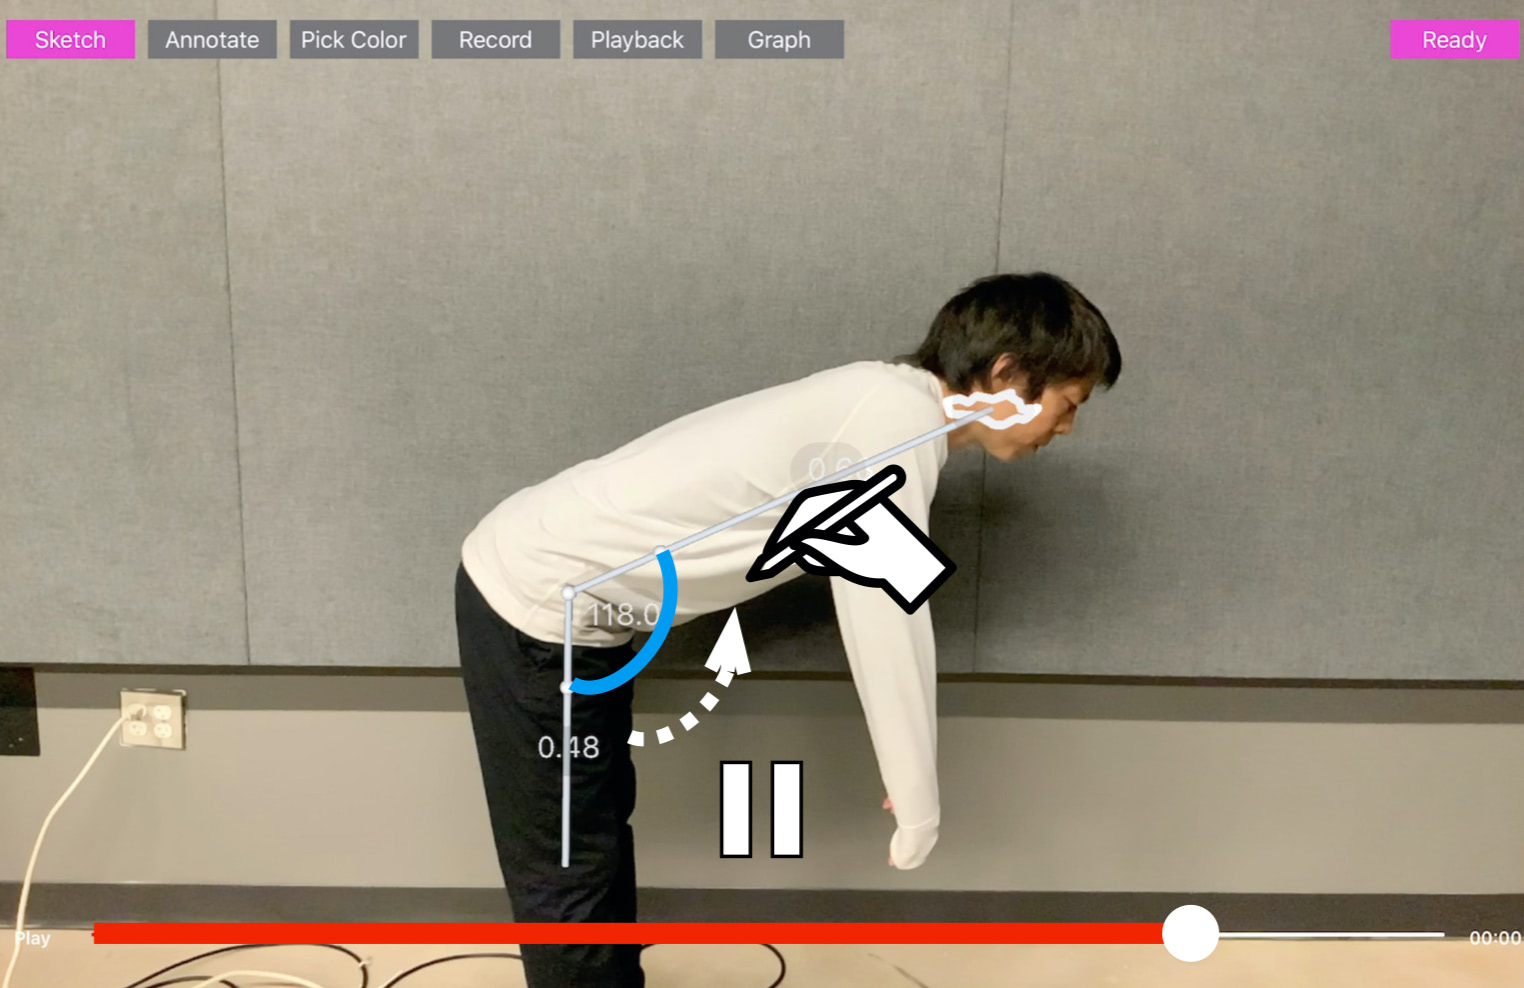
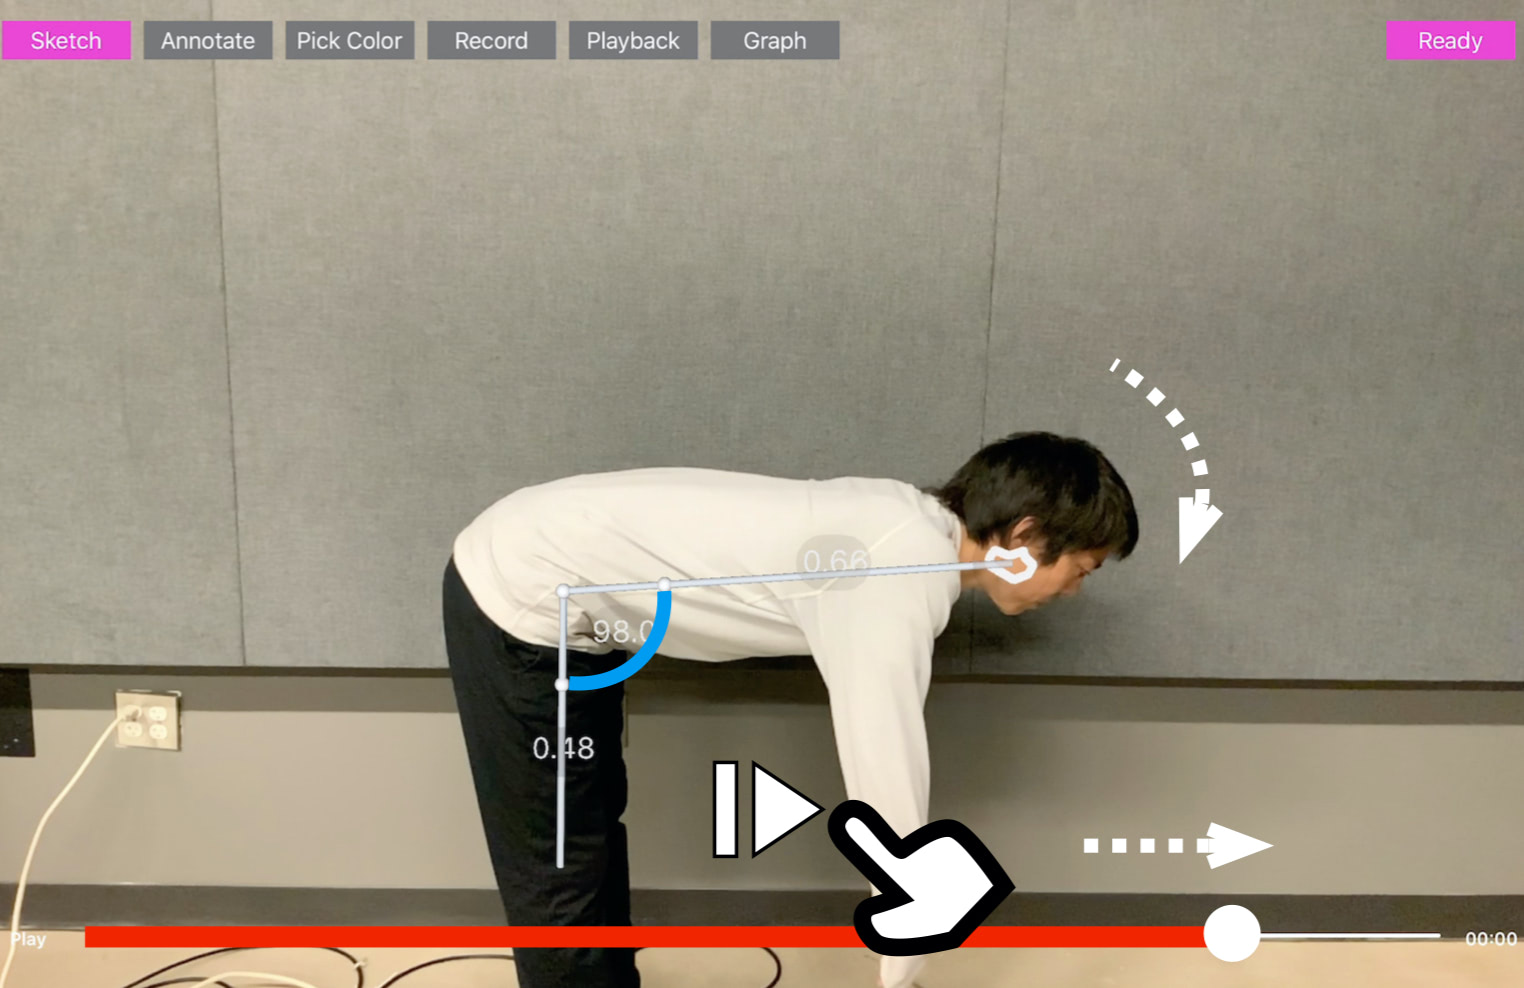
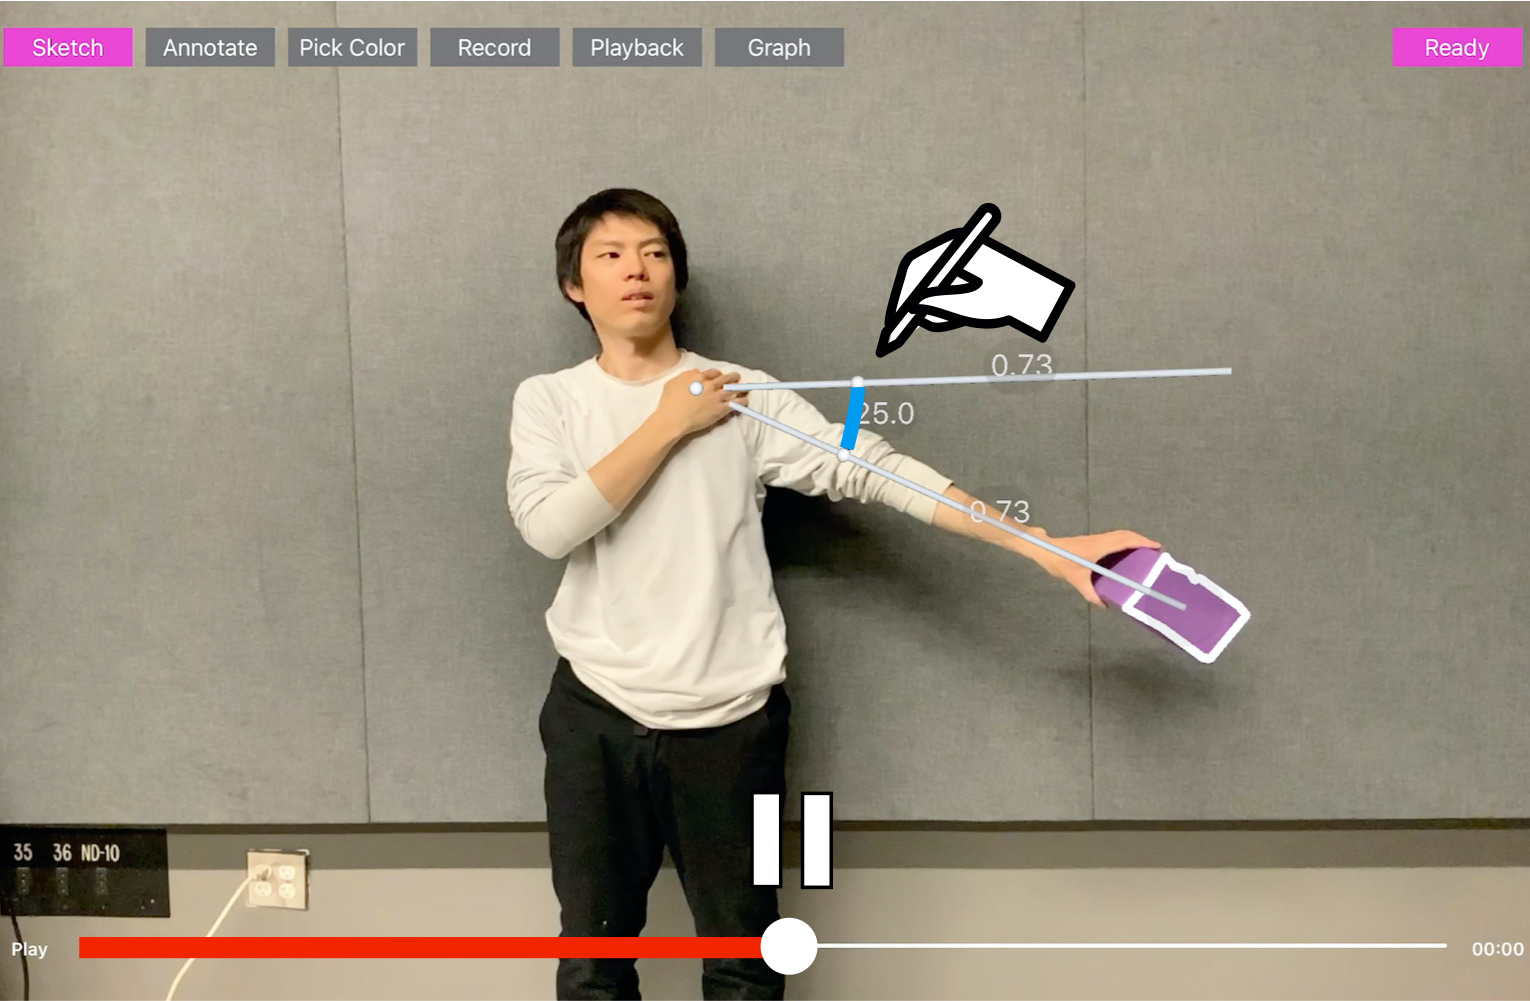
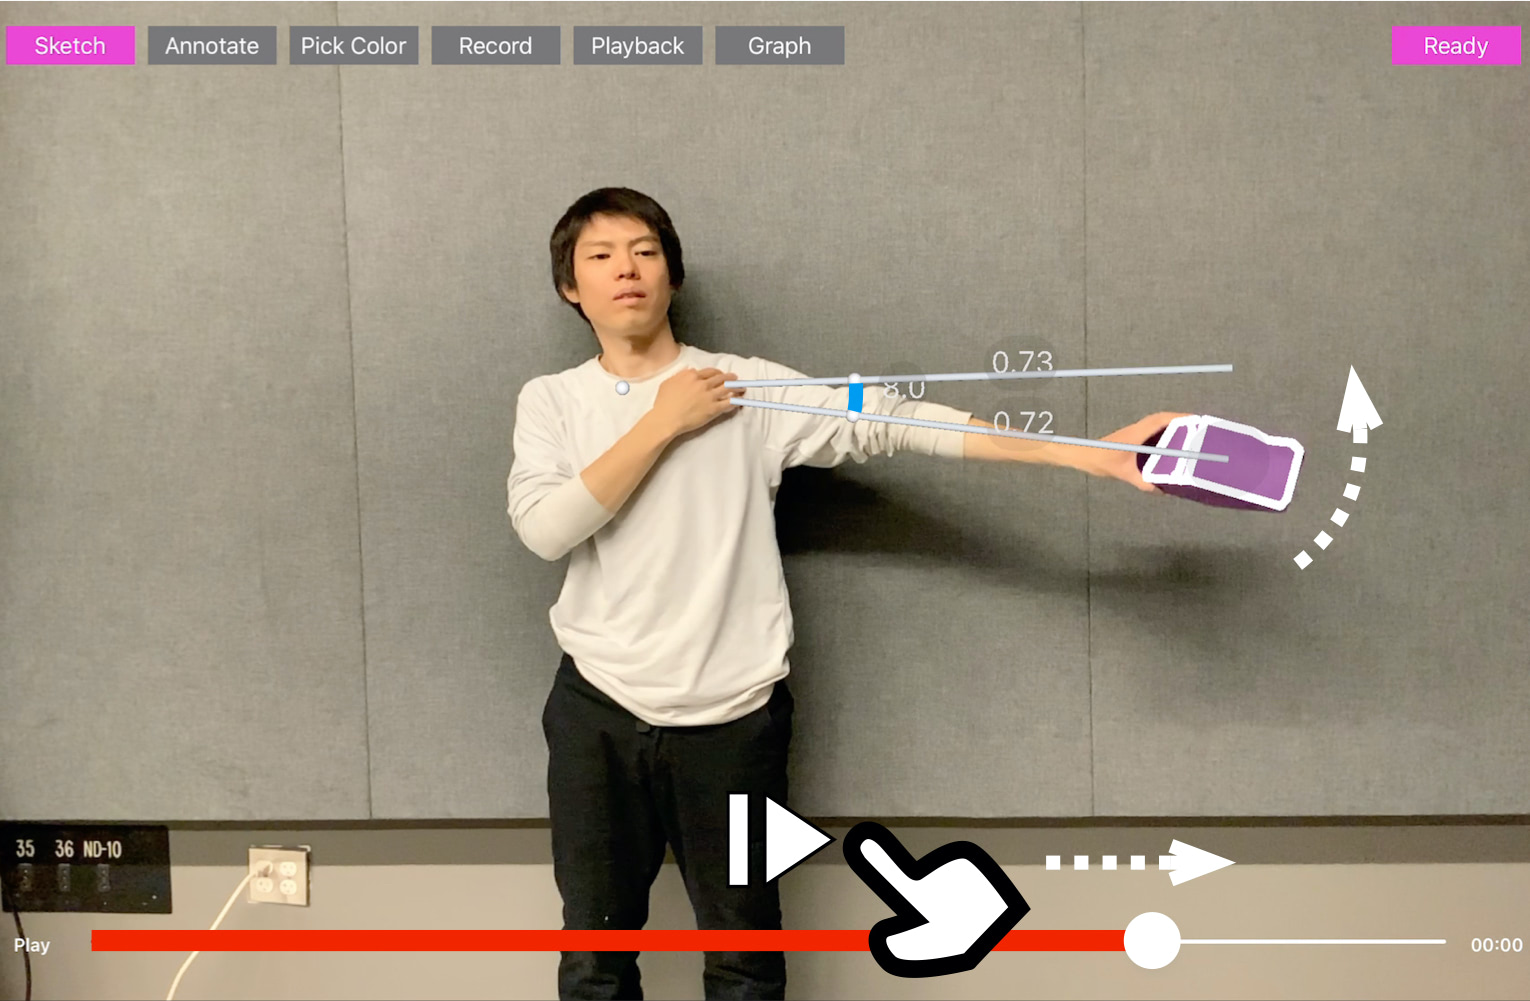
Also, many sports and exercises may require proper form and posture. For example, in baseball batting, golf shot, and a tennis swing, a player’s form, such as a body angle, can be important, which the tool can help visualize through sketched guided lines. These features could be particularly useful for exercise instructions. For example, in yoga practice, bike riding, or weight lifting training, there are recommended angles to be followed to maximize the performance benefits. In these cases, the improvisational measurement of the posture can help the user to see and check if correctly done.

Application 4: In-situ Tangible User Interfaces
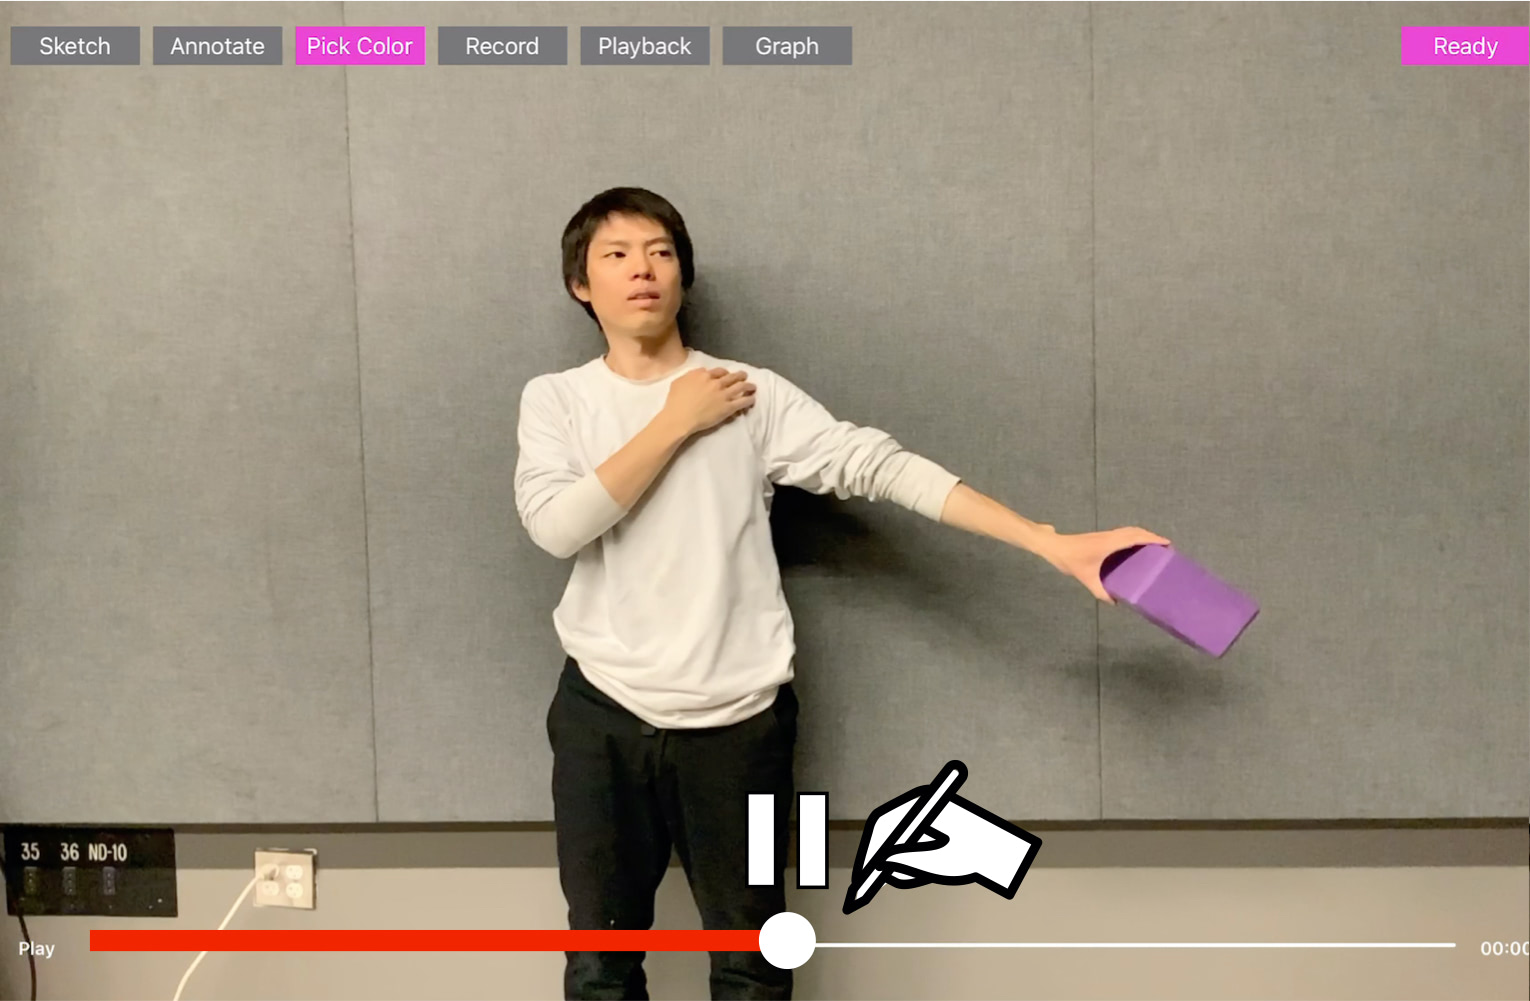
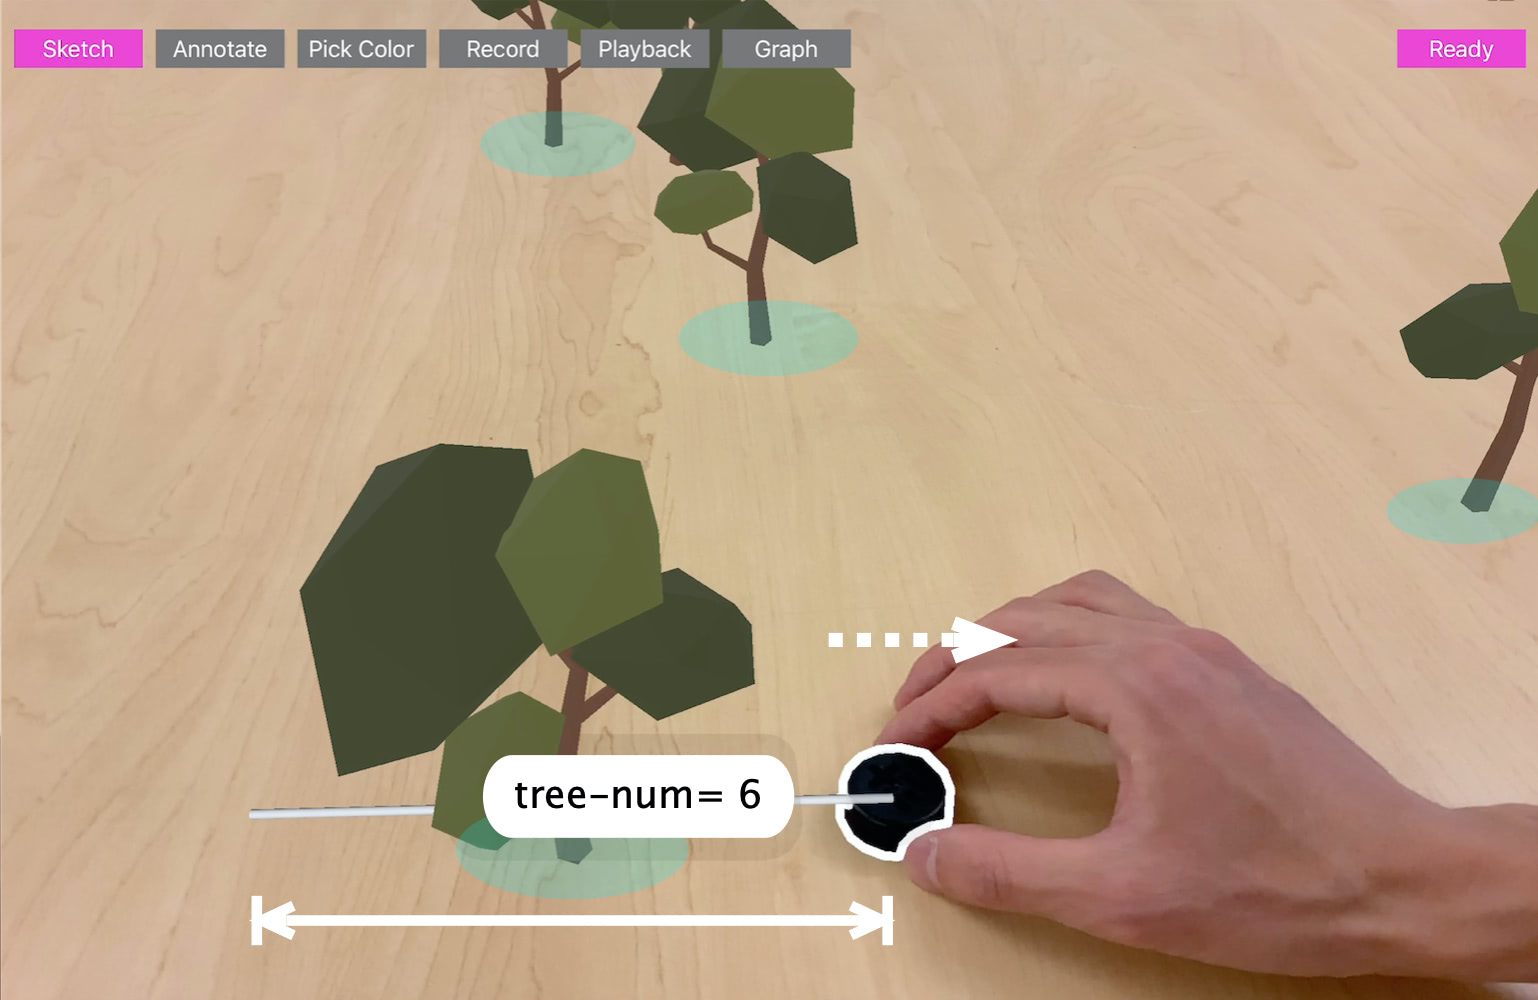
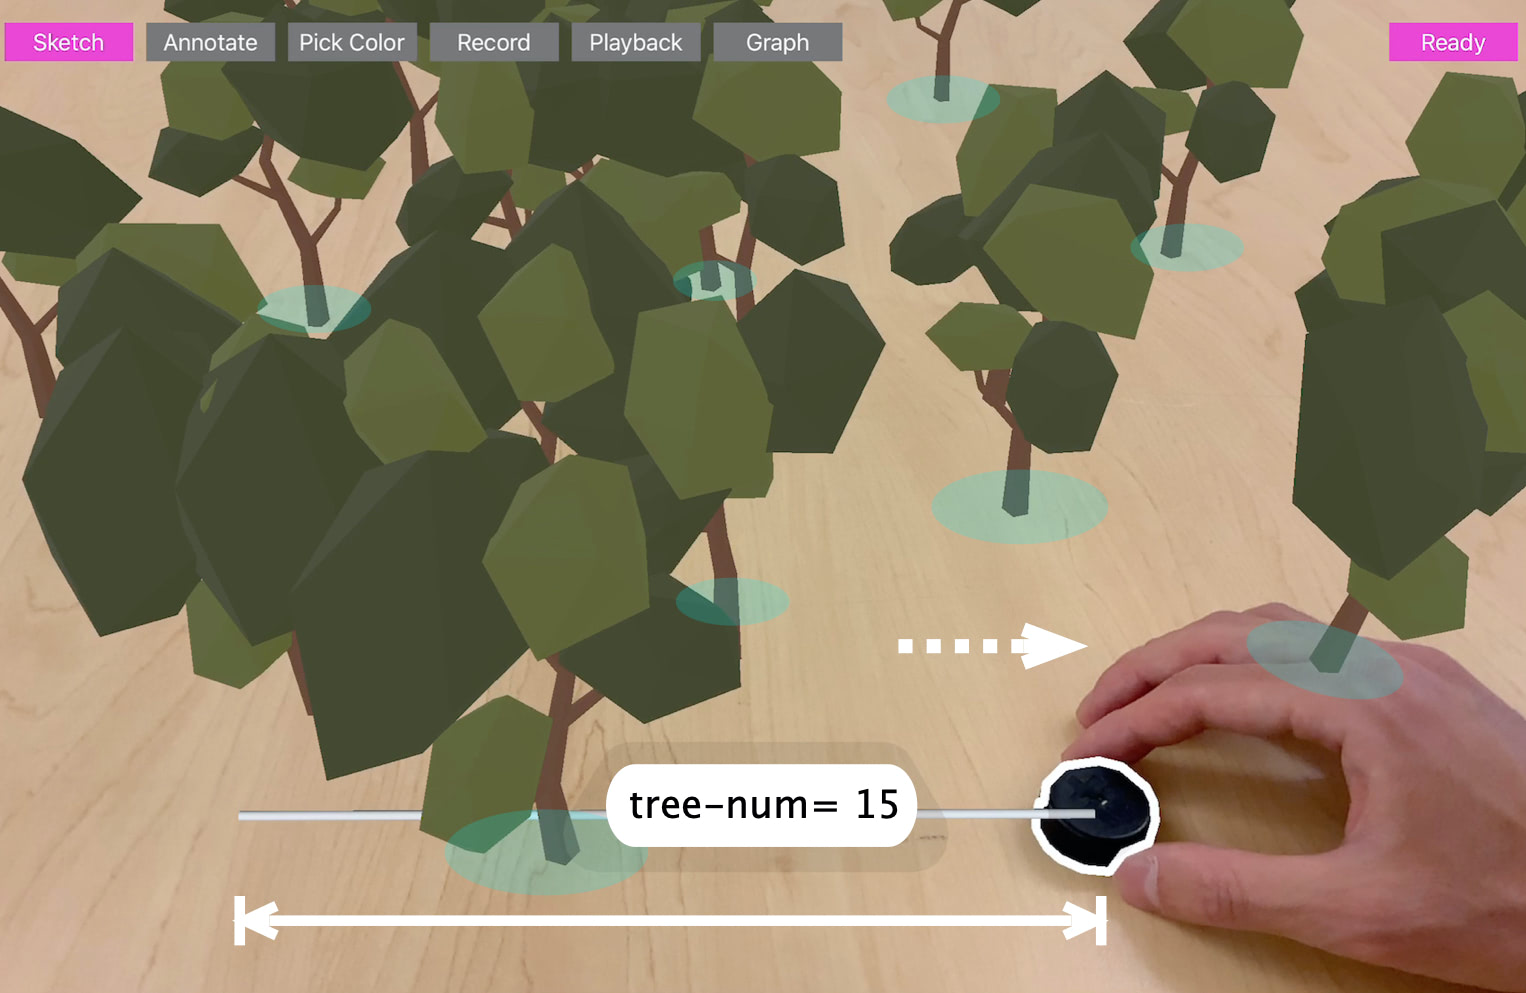
The parameterized value can be used for many different pur- poses to enable responsive visual outputs. So far, we have mostly focused on animation of the simple basic geometry (e.g., line segments, arc) or build-in visualization outputs (e.g., graph plot). However, the dynamic parameter value can be also used for other outputs via binding, as we discussed in the previous sections (e.g., pre-defined vs user-defined section).
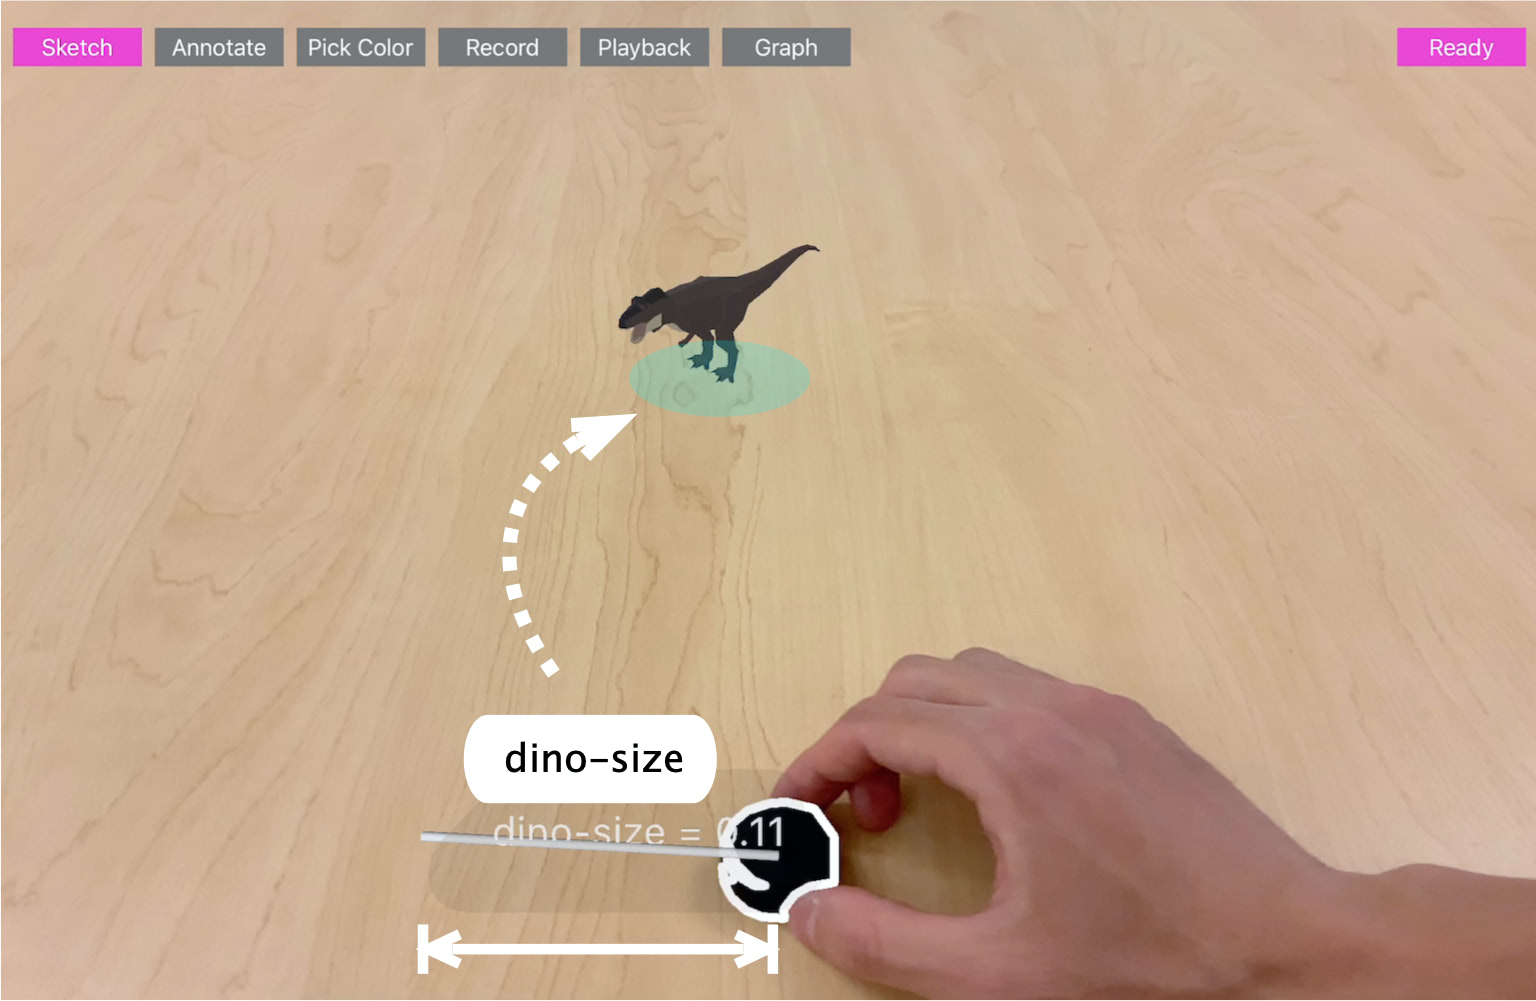
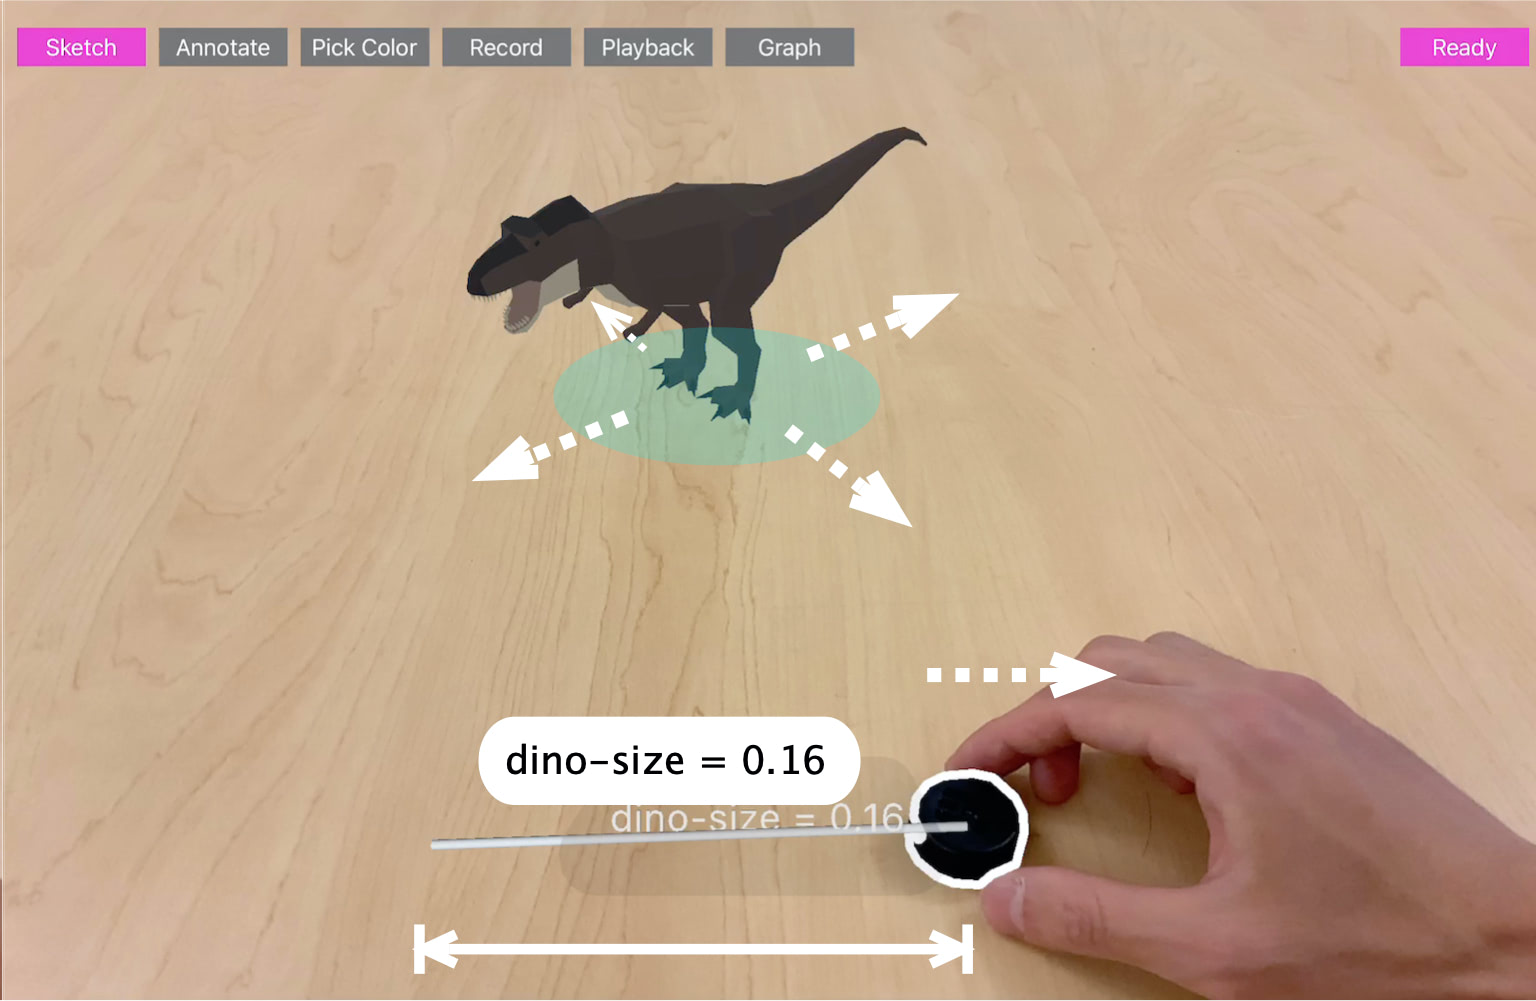
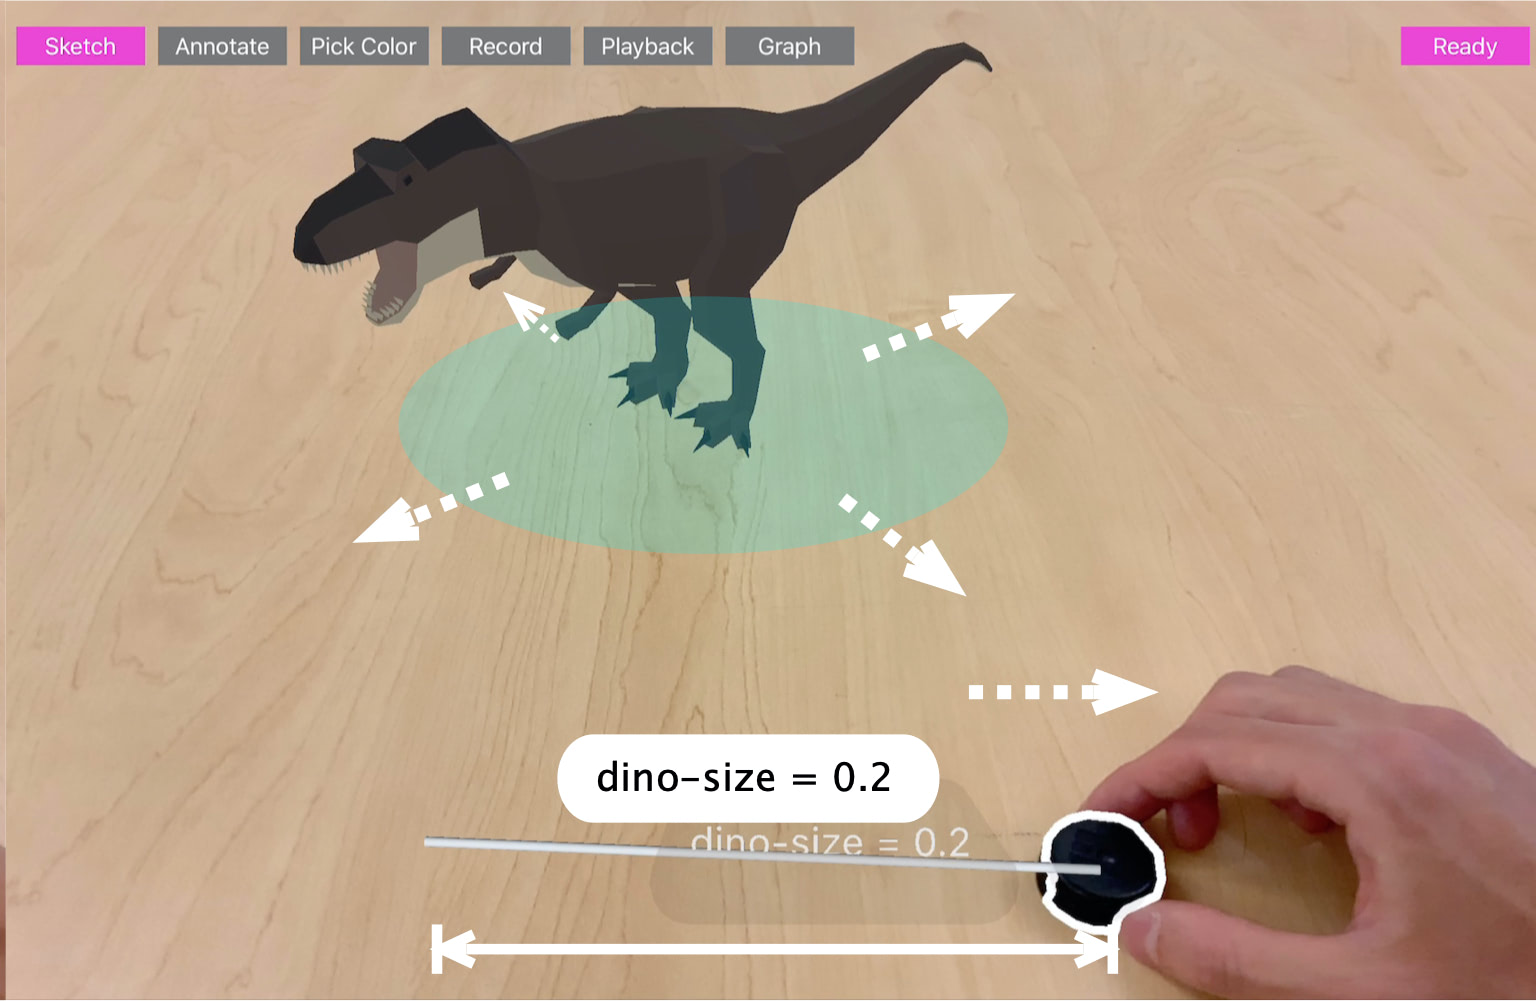
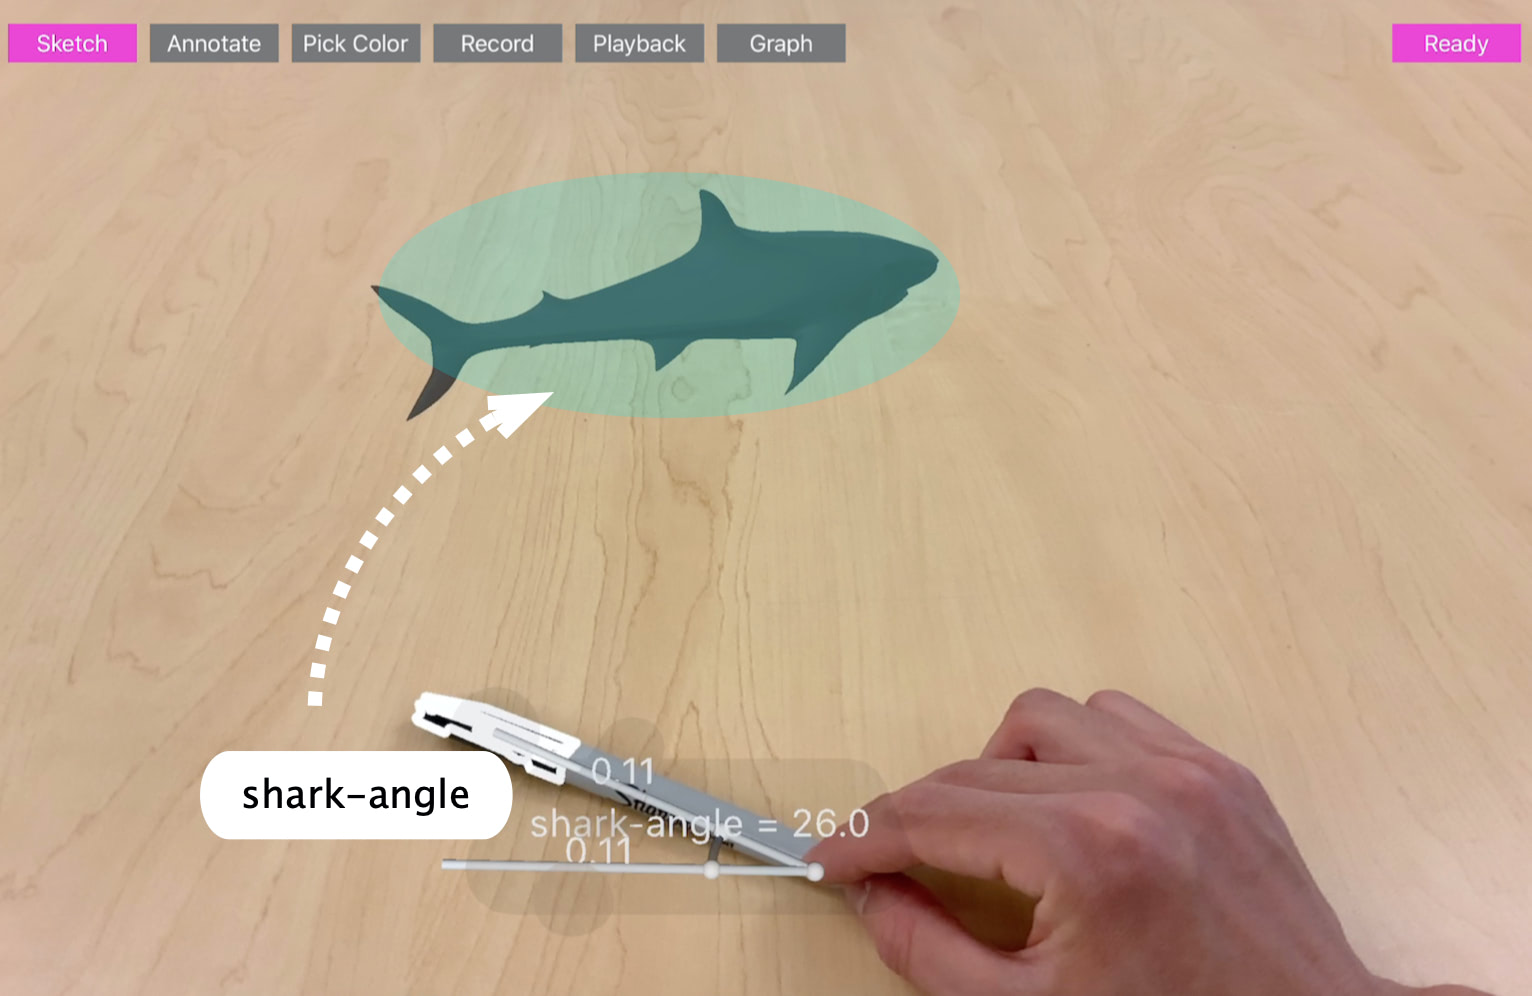
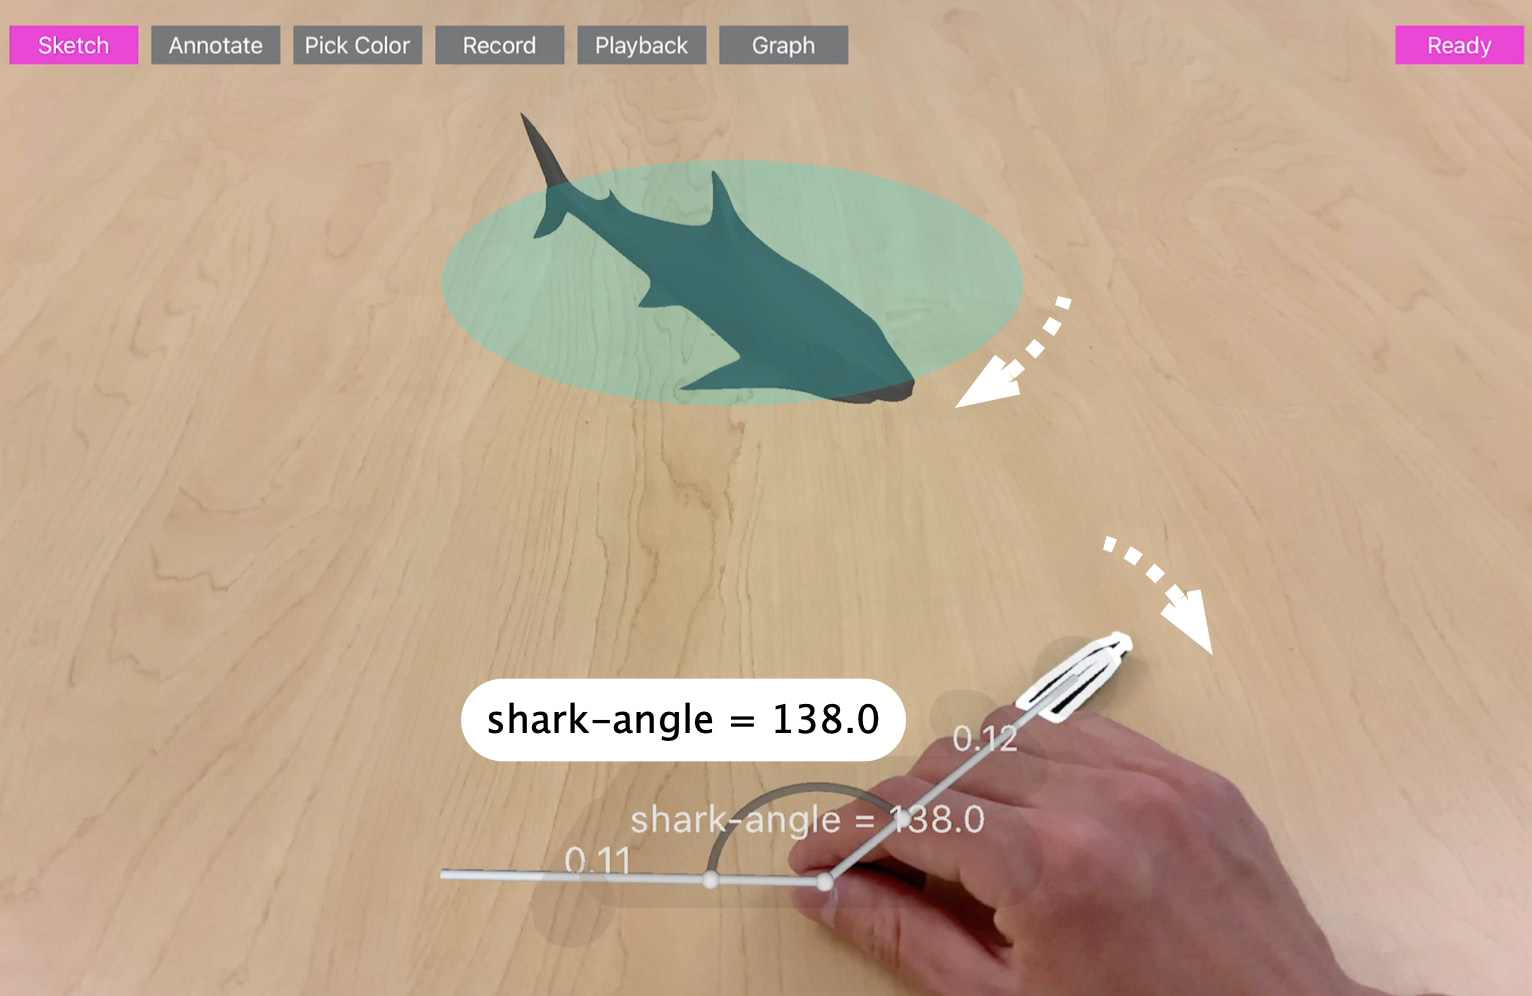
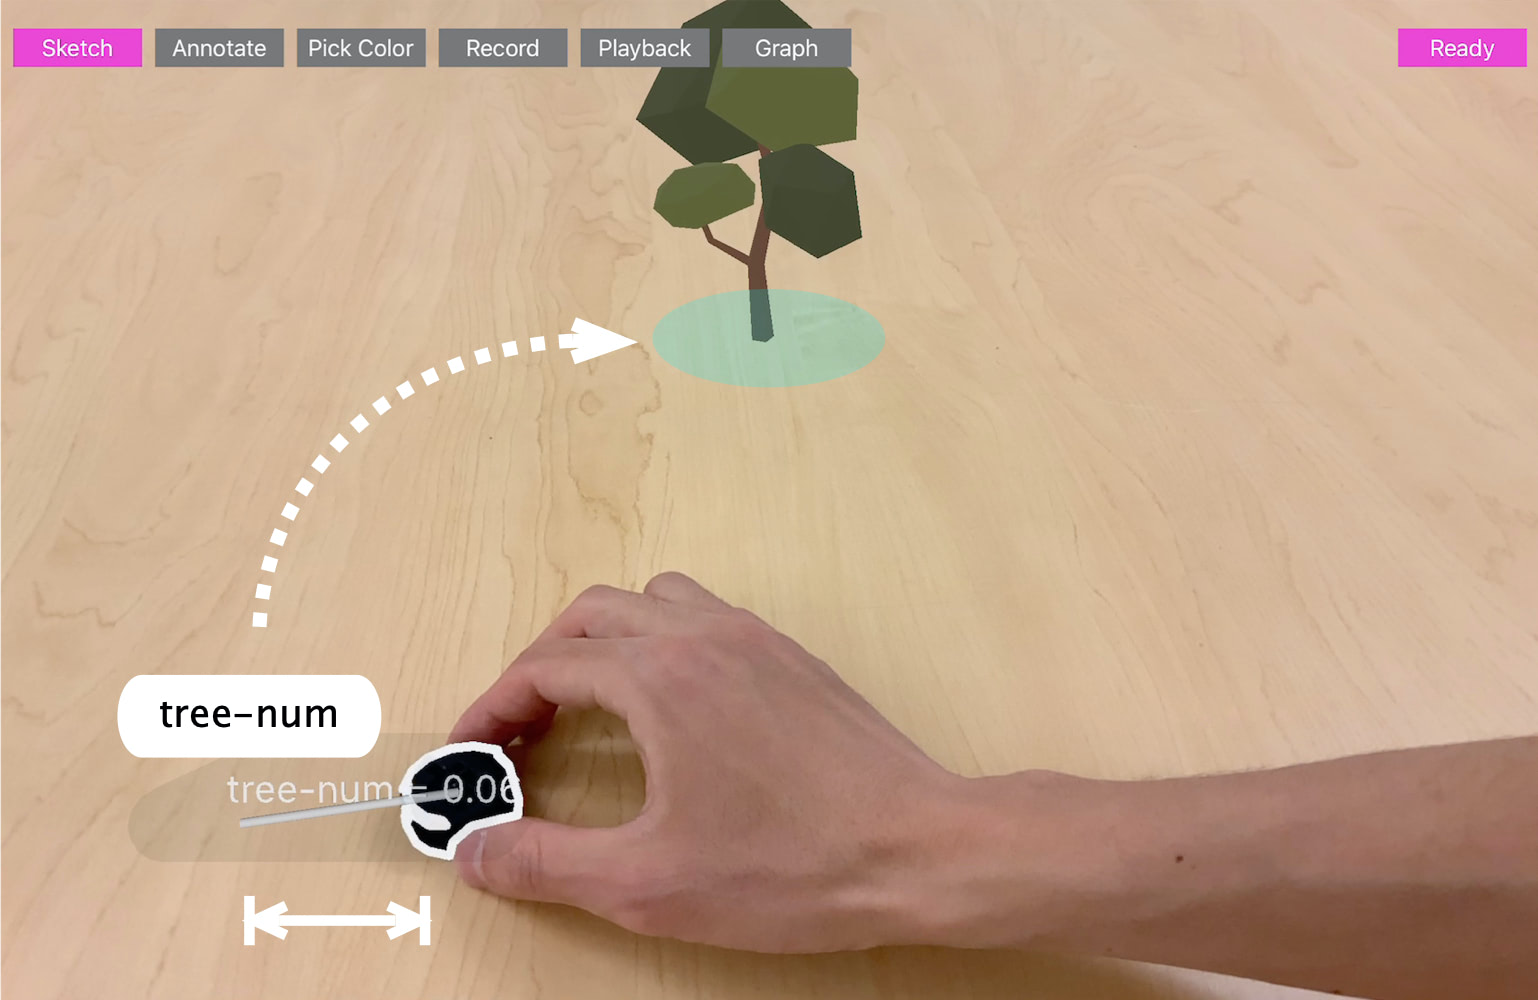
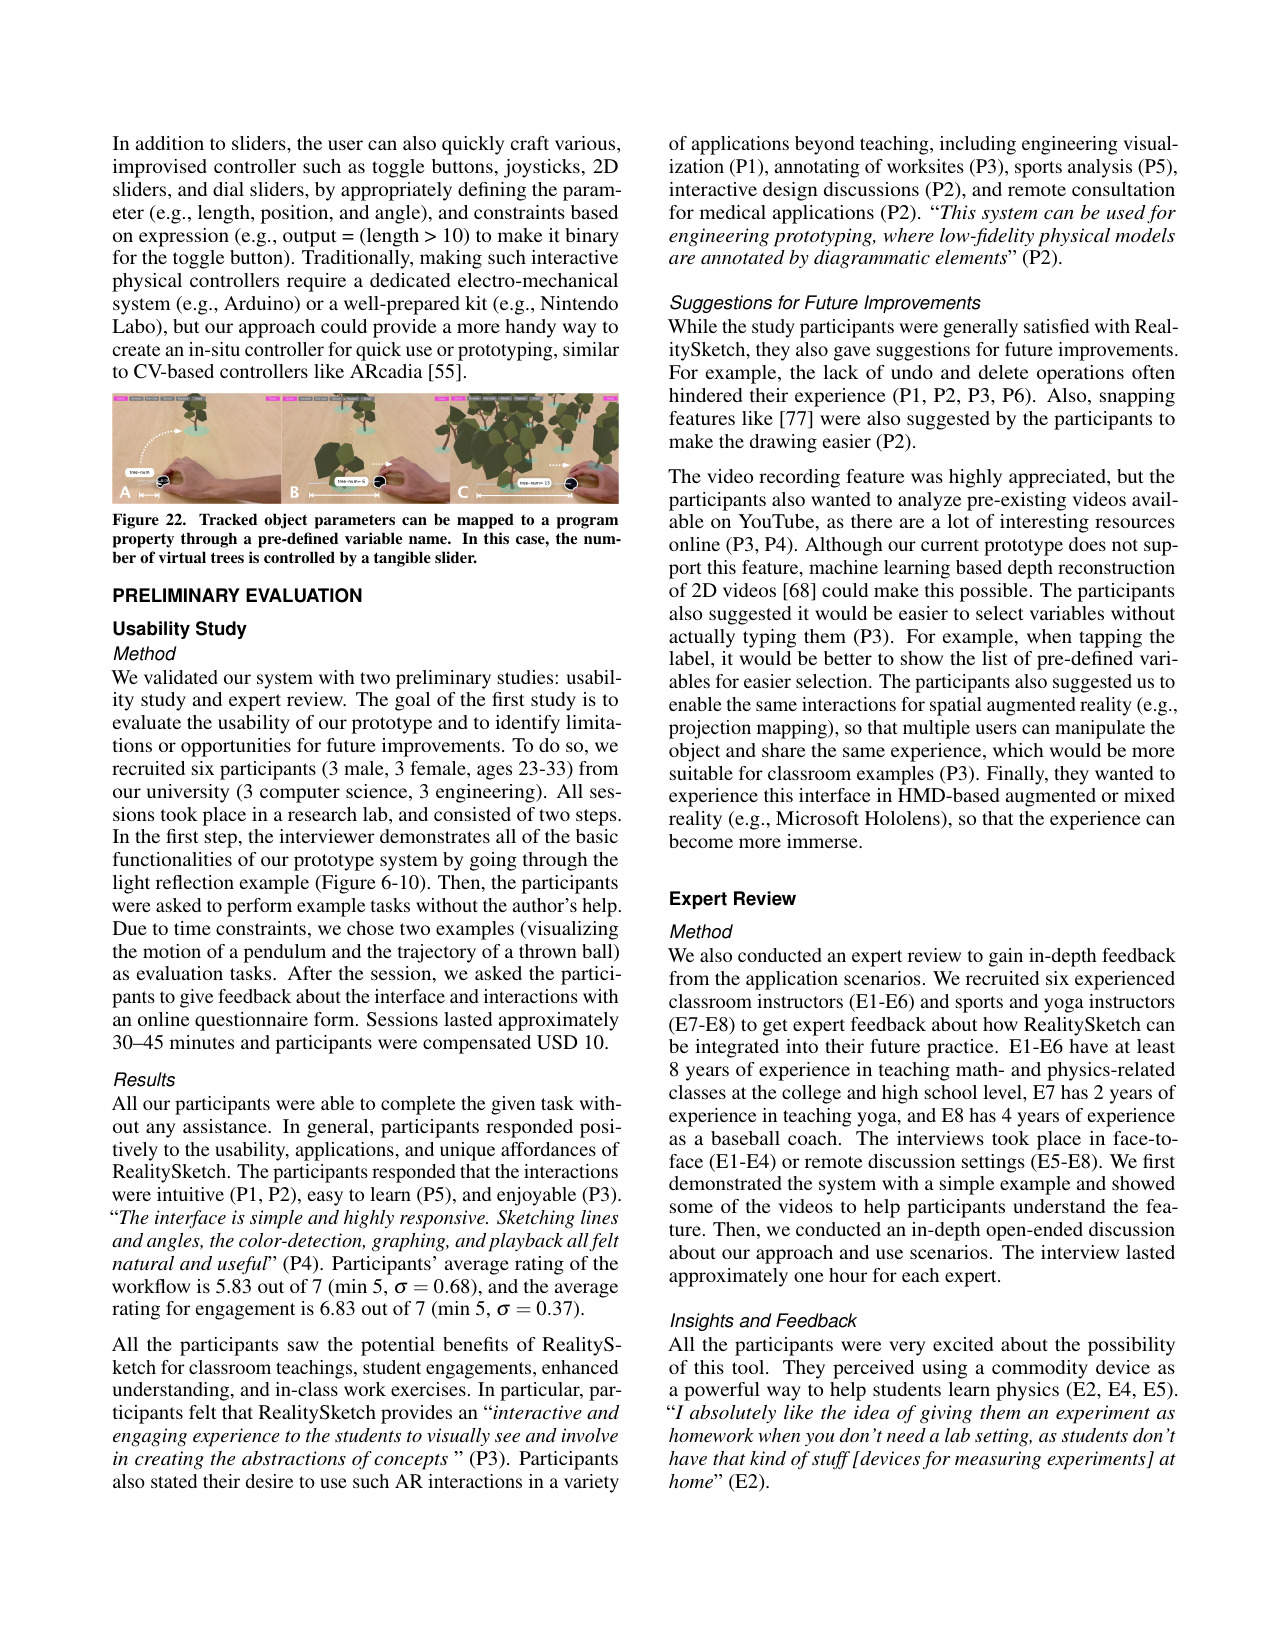
One promising application domain of this is to use these dynamic parameter values as an input of changing a property of existing virtual objects. For example, if one can connect a parameter value to a size property of a virtual 3D model, then the size of the model can dynamically change when the value changes. This use case is particularly useful for in-situ creation of tangible controllers. For example, a colored token can become a tangible slider to change the size of the object. The system could bind these values based on a proper naming rule

Future Vision
We believe there are a lot of future work and a broad design space of embedded and responsive sketching. In general, crafting responsive and embedded graphics in the real-world can be a continuum between two approaches: pre-defined behavior and user-defined behavior. For example, pre-defined behavior refers to a behavior specification given in advance. For example, one can think of a system that specifies all of the sketched elements to follow the law of physics, so that as long as a user draws a virtual element, it automatically falls and bounces on the ground. In this case, the behavior of sketched elements is pre-defined, based on the physics simulation, and the user can only control the shape of the sketches. Similarly, one can imagine a sketched character that starts walking around or interacting with the physical environment. In this case, the behavior of the sketched character should also be defined in advance (by programming or design tools), as it is hard to specify such complex behaviors in real-time. These practices are often utilized in the screen-based sketching interfaces. For example, PhysInk uses a physics engine and ChalkTalk leverages pre-programmed behavior to animate the sketched elements in real-time.
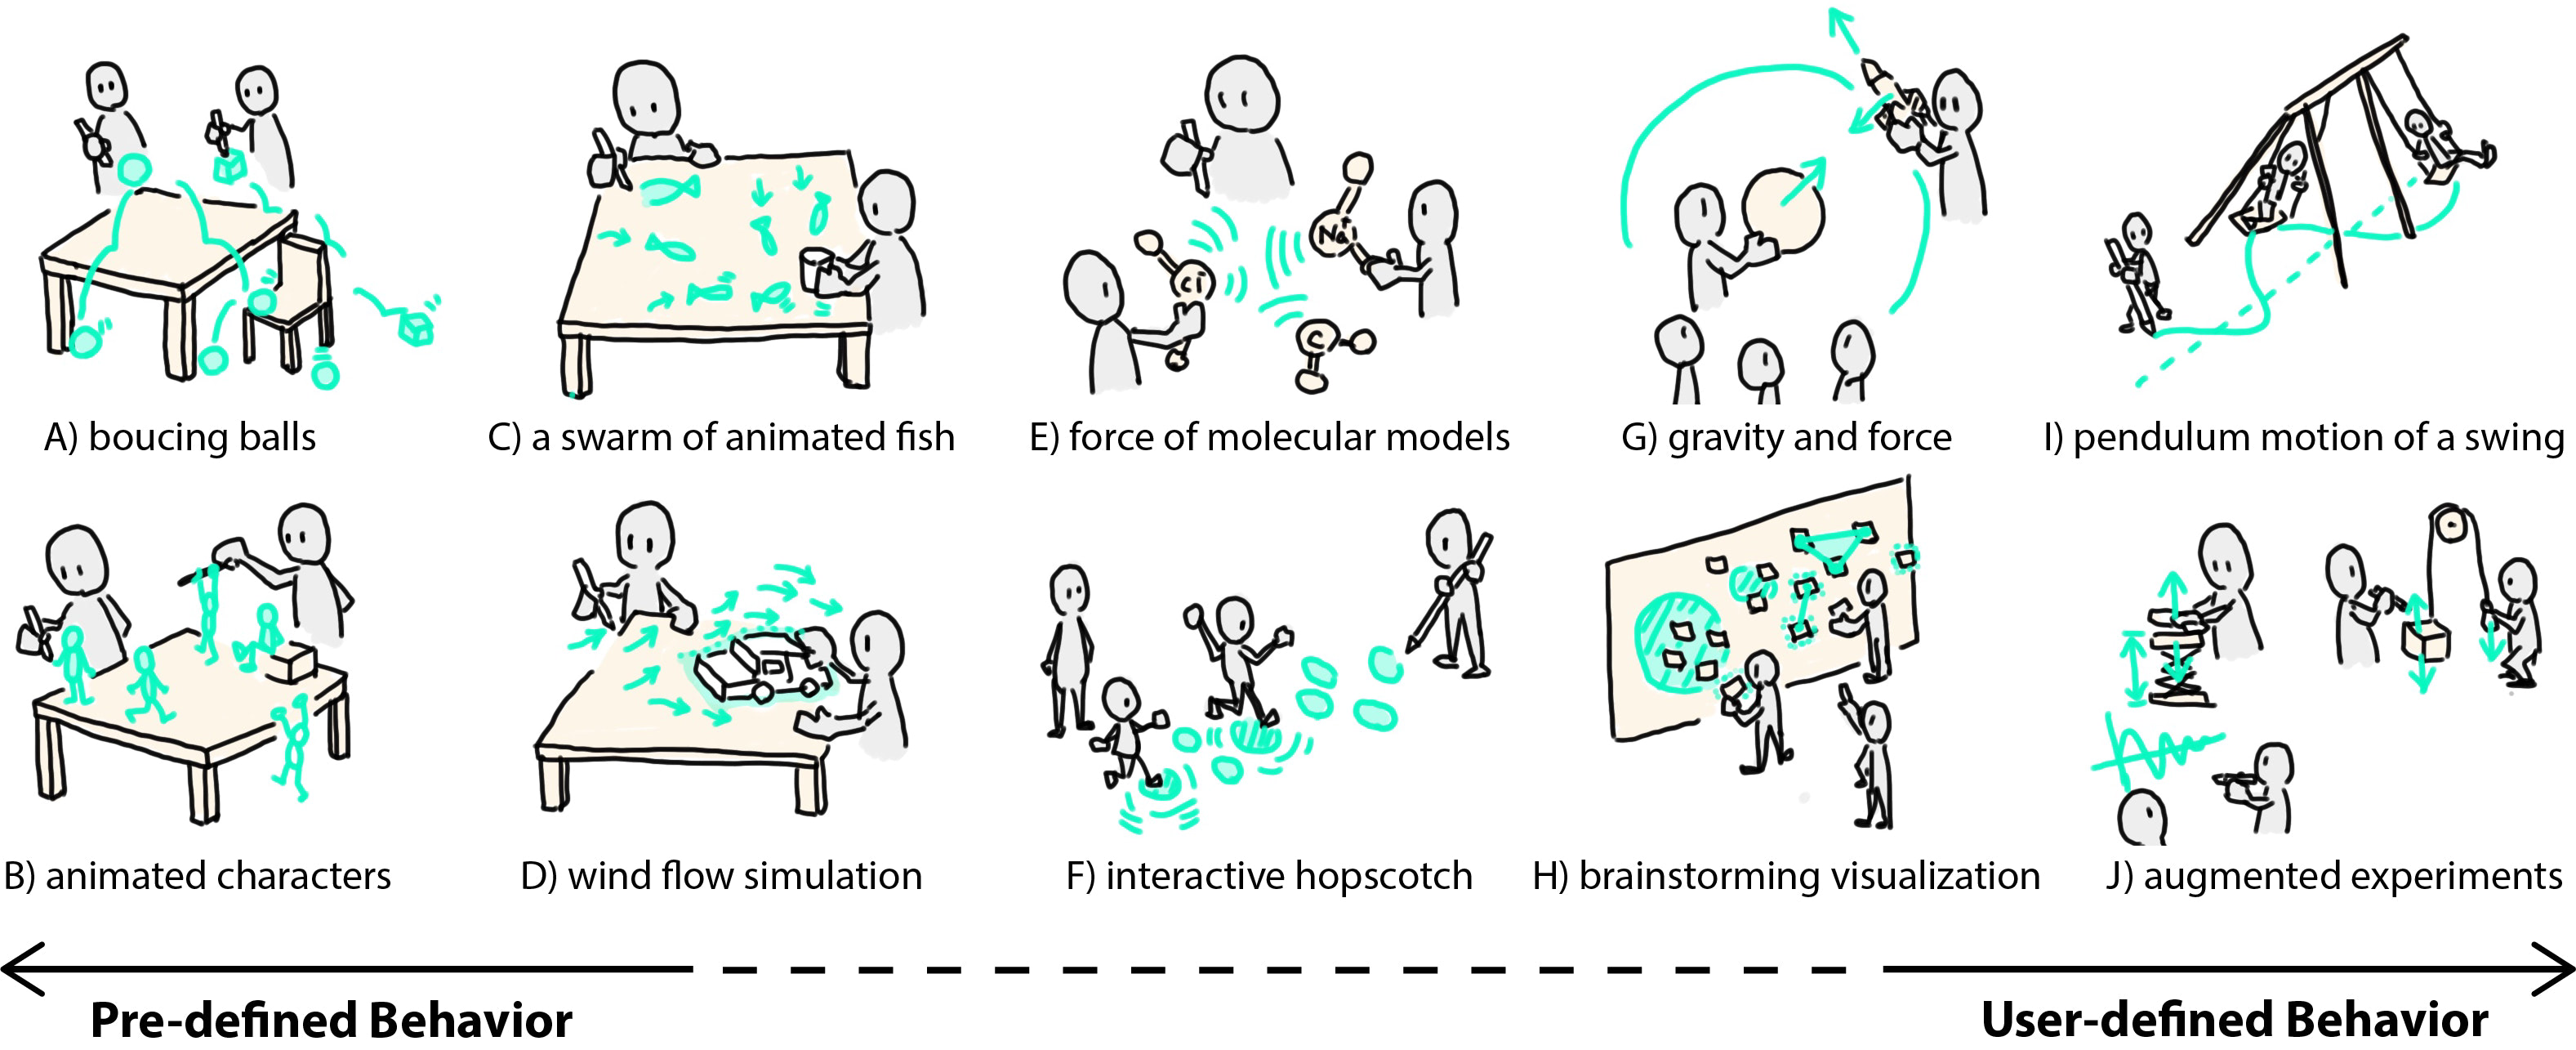
On the other end of the spectrum, user-defined behavior lets the user decide how the sketched elements move, behave, and animate on the fly. For example, consider an example of visualizing pendulum motion. In this example, the user should be able to specify how and which parameter (e.g., angle) will be visualized. In the previous works, Apparatus leverages the user-defined behavior to create interactive diagrams. In this example, the user has full control of how it behaves, based on the user-defined constraints and parameter bindings, which is also known as constraint-based programming. These practices are also utilized to create interactive 2D animation, design exploration, and dynamic data visualization, as it is useful to let the user explicitly specify how it behaves.
We envision the future where the user can draw these dynamic pictures by sketching, like Harold's purple crayon. We hope this paper opens up new opportunities for embedded and responsive sketching and inspires the HCI community to further explore such interactions to realize the full potential of augmented- and mixed-reality (AR/MR) as a dynamic, computational medium.


Publication
Ryo Suzuki, Rubaiat Habib Kazi, Li-Yi Wei, Stephen DiVerdi, Wilmot Li, and Daniel Leithinger. 2020. RealitySketch: Embedding Responsive Graphics and Visualizations in AR through Dynamic Sketching. In Proceedings of the 33rd Annual ACM Symposium on User Interface Software and Technology (UIST '20). ACM, New York, NY, USA, 1-16.
DOI: https://doi.org/10.1145/3379337.3415892
Download PDF


Slide
coming soon